You can use the Workbook Analysis command to create an interactive report that can show detailed information about the workbook and its Structure, Formulas, Cells, Ranges and Warnings.
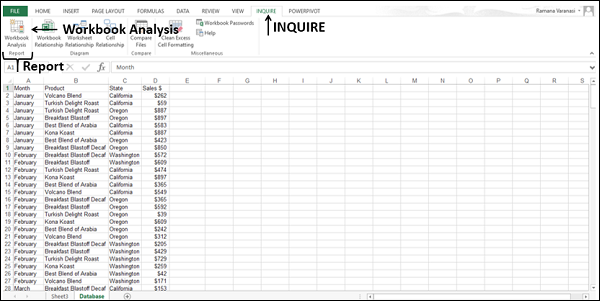
- Click the Inquire tab on the Ribbon.
- Click Workbook Analysis in the Report group.
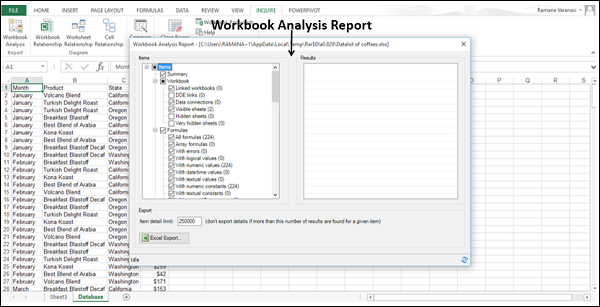
The report will be displayed after the Workbook Analysis is completed.
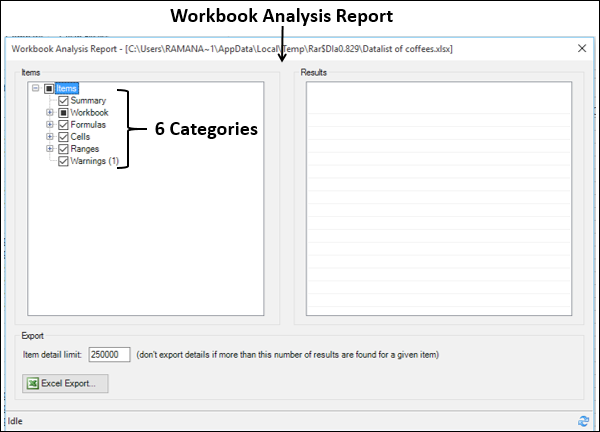
The Report has the following six categories −
- Summary − General information about the structure and content of the workbook.
- Workbook (with subcategories) − General workbook statistics.
- Formulas (with subcategories) − Specific information about formulae in the workbook.
- Cells (with subcategories) − Specific information about cells in the workbook.
- Ranges (with subcategories) − Specific information about ranges in the workbook.
- Warnings − Several types of warnings about workbook structure and content.
Selecting a category gives you more information about that category.
Check the Formulas option. The sub-categories of formulas will be displayed.
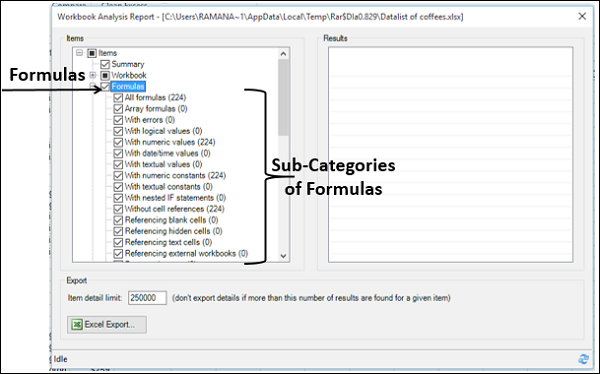
You will observe the following in the workbook that you are analyzing −
- All formulas are 224 in number.
- With numeric values, they are 224 in number.
- Click Sub-Category With numeric values.
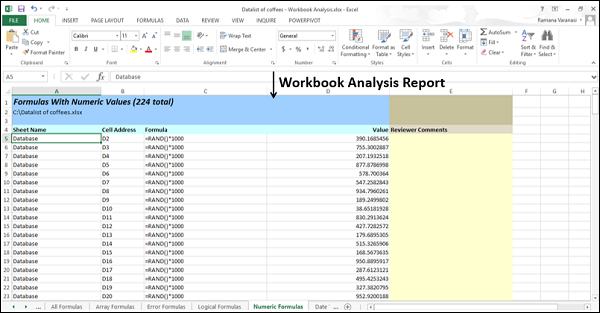
In the Results pane, for each of the cells with formula with numeric values, worksheet name, cell address and formula are displayed.
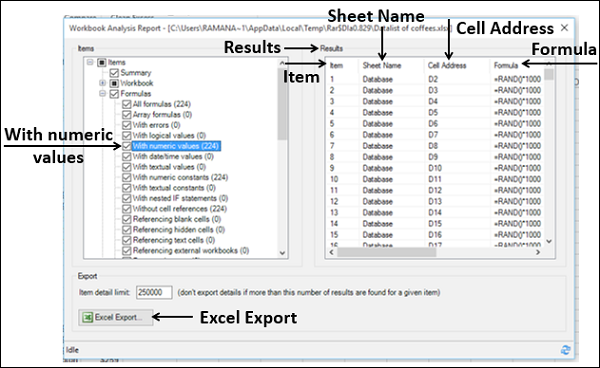
Click the Excel Export button. The Save As dialog box appears.
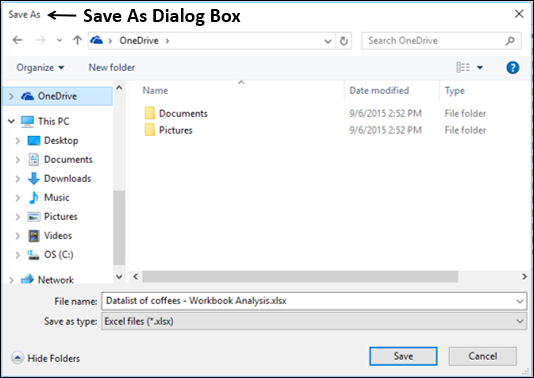
- Save the Report as an Excel file.
- Load Export File button appears next to Excel Export button.
- Click on Load Export File button.
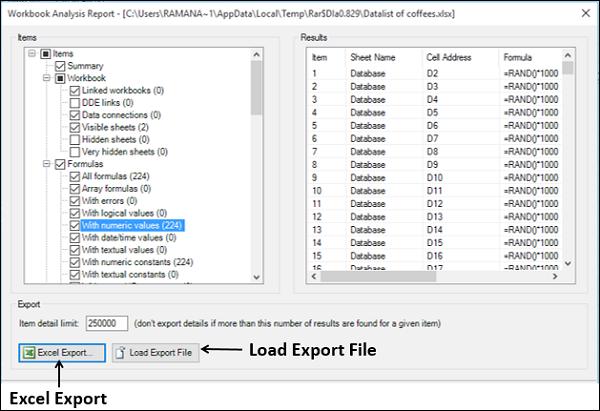
The saved Report Excel workbook opens and you can clearly view the workbook analysis results.
Viewing with Diagrams
You can view workbook relationships, worksheet relationships and cell relationships with interactive diagrams created by links. The links show the dependencies between the nodes in the diagram. You can drag the links or nodes to arrange them and align them to view whatever you are looking for.
Viewing Workbook Relationships
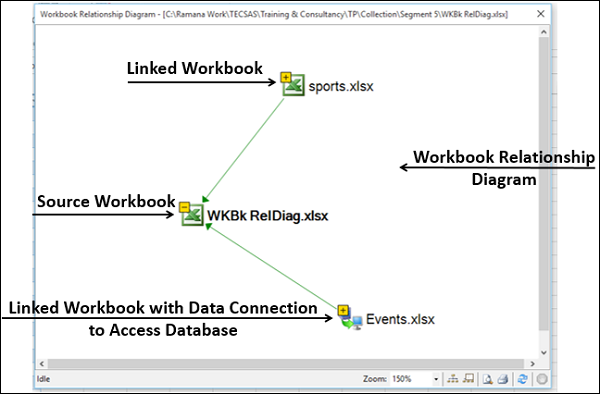
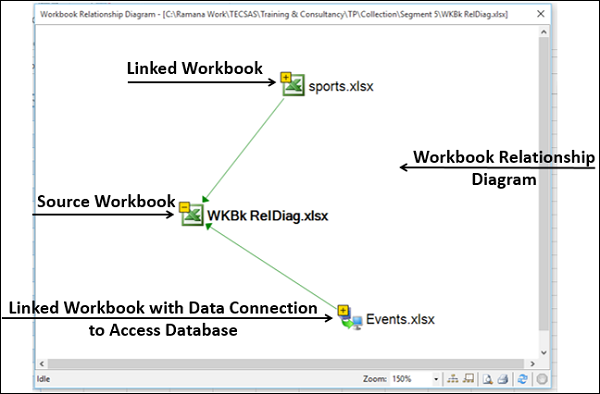
You can have an interactive, graphical map of workbook dependencies created by connections (links) between files using workbook relationship diagram.
The types of links in the diagram can include other workbooks, Access databases, text files, HTML pages, SQL Server databases and other data sources.
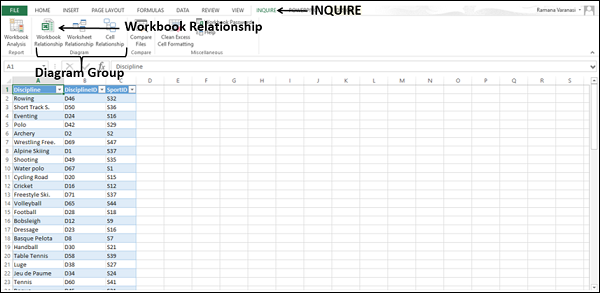
- Click the INQUIRE tab on the Ribbon.
- Click Workbook Relationship in the Diagram group.
The Workbook Relationship Diagram appears, showing links of the workbook with different Data Sources.
Viewing Worksheet Relationships
You can use Worksheet Relationship Diagram to create an interactive, graphical map of connections (links) between worksheets in the same workbook and /or worksheets in other workbooks.
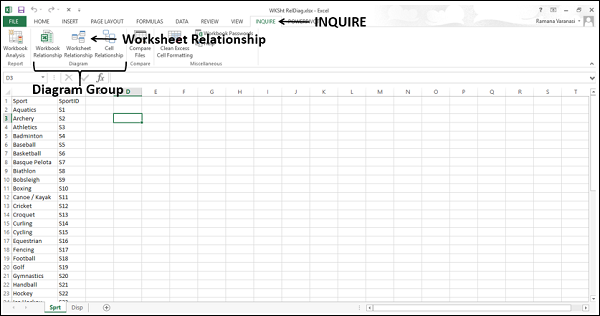
- Click the INQUIRE tab on the Ribbon.
- Click Worksheet Relationship in the Diagram group.
The Worksheet Relationship Diagram appears, showing links between the worksheets in the same workbook, and in other workbooks.
The difference between these two can be identified by the direction of the arrows.