

In today’s data-driven world, businesses and professionals are constantly searching for ways to make smarter decisions, understand trends, and stay ahead of competition. Microsoft Power BI stands out as one of the most powerful and user-friendly tools for turning raw data into meaningful insights. Whether you’re a business owner, entrepreneur, analyst, student, or even a beginner to tech, Power BI gives you the ability to visualize your data and present it in a clear, professional, and interactive way. Power BI is part of Microsoft’s suite of business intelligence (BI) tools designed to help individuals and organizations analyze information, share insights, and make informed decisions faster. From small startups to large enterprises, Power BI empowers everyone to see the story behind the numbers.
What is Power BI?

Power BI is a business analytics tool developed by Microsoft that connects to various data sources—such as Excel files, SQL databases, cloud services, and online platforms like Google Analytics—and transforms that data into visually appealing dashboards and reports.
In simple terms, Power BI helps you see your data clearly, explore trends, uncover hidden patterns, and share your findings with others. It replaces complicated spreadsheets with clean, interactive visuals that tell a compelling story. Power BI supports connections to over 100 different data sources, making it flexible for all kinds of businesses and use cases—from finance and sales to healthcare, education, and even social media analysis.
How Does Power BI Work?

Power BI works by connecting to your data sources, cleaning and transforming your data, and then letting you build visual reports using drag-and-drop tools.
It has three main components:
- Power BI Desktop – This is the primary tool for building reports. You can import data, clean it using Power Query, create relationships between tables, write DAX formulas, and build dashboards using drag-and-drop visuals.
It is completely free and installed on your computer.

- Power BI Service (Online) – Once your reports are ready, you can publish them to the cloud. This allows you to: Share dashboards with your team, Schedule automatic data refresh, Access your reports from anywhere, Embed dashboards in apps or websites
It’s perfect for collaboration and enterprise-level reporting.
- Power BI Mobile App – This allows you to access your dashboards and reports on the go, from any device.
It’s like having a personal data assistant that helps you make sense of numbers, trends, and business metrics anytime, anywhere.
Understanding Key Power BI Concepts
Power Query (Data Cleaning)
This tool helps you transform messy, raw data into a clean and structured format.
You can remove duplicates, fix errors, merge tables, split columns, and perform hundreds of data cleaning operations without writing code.
Data Modeling
This is one of the most important aspects of Power BI.
Data modeling allows you to:
- Create relationships between different tables
- Build star schemas
- Optimize your data for faster performance
- Ensure your visuals show accurate results
A good data model is the foundation of every great dashboard.
DAX (Data Analysis Expressions)
DAX is the formula language used in Power BI, similar to Excel formulas but more powerful.
With DAX, you can:
- Create measures
- Build custom calculations
- Perform time intelligence (YTD, QTD, MTD analysis)
- Analyze trends and totals
It brings your data to life and helps you create strong analytical insights.
Important Features of Power BI
Power BI comes with a wide range of features that make it unique:
✔ Interactive Visualizations
From bar charts to maps, KPIs, gauges, and AI visuals, Power BI offers dozens of customizable charts.
✔ AI-Powered Insights
Features like “Quick Insights” and “Key Influencers” automatically analyze your dataset and explain relationships and patterns.
✔ Natural Language Queries (Q&A Visual)
You can simply ask a question like “What are the top 5 products by sales in 2024?” and Power BI will generate the answer.
✔ Real-Time Dashboards
You can monitor live data streams—perfect for operations, logistics, and financial performance tracking.
✔ Embedded Analytics
Businesses can embed Power BI dashboards inside their websites, portals, or apps.
Is Power BI Secure?

Yes, absolutely. Microsoft takes data security seriously. Power BI uses Azure Active Directory (AAD) for authentication and role-based access, ensuring that only authorized users can access reports or datasets.
It’s also compliant with key industry standards such as ISO 27001, GDPR, and HIPAA. Data is encrypted both at rest and in transit using Microsoft-managed encryption keys. For businesses that handle sensitive data, this means peace of mind—knowing that insights can be shared safely without compromising security.
Power BI Pricing
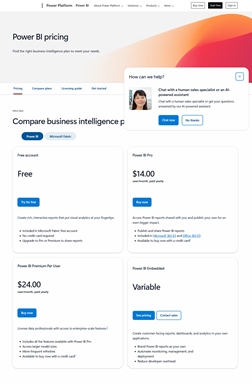
One of the things that makes Power BI attractive is its flexible pricing.
- Power BI Desktop is completely free, allowing individuals to create reports and explore data locally.
- Power BI Pro, which costs around $10 per user per month, lets you collaborate, share dashboards, and work with cloud-based data.
- Power BI Premium, designed for larger organizations, offers advanced features like dedicated cloud capacity, AI-powered data flows, and on-premises report deployment through Power BI Report Server.
The tiered pricing ensures that both small businesses and large enterprises can find an option that fits their budget and needs.
Why Choose Power BI?

1. Easy to Use
You don’t need coding skills. Most things work through drag-and-drop.
2. Strong Microsoft Ecosystem Integration
It works naturally with Excel, SharePoint, Teams, Azure, SQL Server, and more.
3. Massive Data Connectivity
You can connect to:
- Excel
- SharePoint
- SQL databases
- Google Analytics
- Salesforce
- Cloud platforms
- APIs
4. Automation and Refresh
Data can update automatically every hour, day, or week.
5. Scalability
Power BI grows with your business—from 1 person to 10,000 users.
Real-World Use Cases of Power BI
1. Small Businesses
Track sales, inventory, expenses, and daily performance.
2. Finance Departments
Create budgets, forecasting models, and cashflow dashboards.
3. Marketing Teams
Monitor social media engagement, campaign performance, and customer behavior.
4. Schools & Universities
Analyze student performance, attendance, and enrollment patterns.
5. Healthcare
Monitor patient data, hospital operations, and treatment outcomes.
6. Logistics & Supply Chain
Track deliveries, inventory movement, and operational efficiency.
Power BI Career Relevance
Learning Power BI opens opportunities for roles such as:
- Data Analyst
- Business Analyst
- BI Analyst
- Reporting Analyst
- Financial Analyst
- Product Analyst
Many companies now expect analysts to know Power BI because it’s fast, affordable, and easy to integrate.
Limitations of Power BI (Important to Know)
Power BI is powerful, but not perfect.
Some limitations include:
- Large datasets may require Power BI Premium
- Complex DAX formulas have a learning curve
- Some visuals are limited in customization
- API-based data sources sometimes require advanced setup
Still, for its price and capabilities, Power BI offers incredibly high value.
Final Verdict
If you’re looking for an intuitive, powerful, and cost-effective tool to visualize and analyze your data, Microsoft Power BI is a fantastic choice.
It’s secure, easy to learn, and scales with your business. Whether you’re tracking sales, monitoring performance, or presenting insights to stakeholders, Power BI transforms the way you see and understand data.