

A stacked bar chart is used when you want to compare values across categories and see how each value is divided into sub-categories. Unlike a regular bar chart, stacked bars show both the total and the composition of that total in one visual.
This article explains how to create a stacked bar chart in Power BI, when to use it, how to configure it correctly, and best practices for professional dashboards.
What Is a Stacked Bar Chart in Power BI?
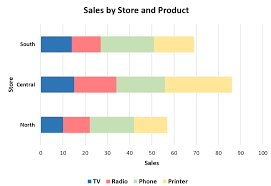
A stacked bar chart displays horizontal bars that are divided into colored segments. Each segment represents a sub-category, and the full bar length represents the total value.
In Power BI:
- Categories appear on the Y-axis
- Values appear on the X-axis
- Sub-categories appear in the Legend
This visual makes it easy to compare both totals and proportions at the same time.
When to Use a Stacked Bar Chart
Use a stacked bar chart when you want to:
- Compare totals across categories
- Show contribution of sub-categories
- Analyze distribution within each category
- Present data with multiple dimensions
Common Use Cases:
- Sales by product broken down by region
- Expenses by department broken down by type
- Revenue by year broken down by channel
If comparison of totals is important and composition matters, a stacked bar chart is ideal.
Preparing Your Data for a Stacked Bar Chart
Your data should contain at least three columns:
| Category | Sub-Category | Value |
|---|---|---|
| Product A | Online | 120 |
| Product A | Store | 80 |
| Product B | Online | 95 |
In Power BI:
- Category → text field
- Sub-category → text field
- Value → numeric field
Ensure data types are correct before creating the visual.
Step-by-Step: How to Create a Stacked Bar Chart
Step 1: Load Your Data
- Open Power BI Desktop
- Click Get Data
- Select your data source
- Load the dataset
Step 2: Select the Stacked Bar Chart Visual
- Go to Report View
- In the Visualizations pane, select Stacked Bar Chart
Step 3: Assign Fields
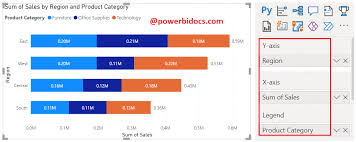
- Drag Category → Y-Axis
- Drag Value → X-Axis
- Drag Sub-Category → Legend
Power BI will automatically stack the bars.
Formatting a Stacked Bar Chart for Clarity
Proper formatting improves readability.
Key Formatting Options:
- Data labels: Show values or percentages
- Legend position: Top or right
- Colors: Use contrasting but consistent colors
- Total labels: Enable where necessary
Sorting Tip:
Sort by total value, not individual segments, for meaningful comparison.
Using Percent Stacked Bar Charts
A 100% stacked bar chart shows proportions instead of absolute values.
When to Use:
- Comparing percentages
- Showing distribution without focusing on totals
To use:
- Select 100% Stacked Bar Chart
- Assign the same fields
This helps highlight composition differences clearly.
Enhancing Stacked Bar Charts with Interactivity
Enhance user experience by adding:
- Slicers (Date, Region, Category)
- Tooltips for extra context
- Drill-through for detailed analysis
This allows users to explore the data interactively.
Common Mistakes to Avoid
Avoid:
- Too many sub-categories (cluttered bars)
- Similar colors for segments
- Using stacked bars when totals are unclear
- Ignoring sorting
If clarity suffers, consider a clustered bar chart instead.
Conclusion
Stacked bar charts are powerful tools for showing both comparison and composition in a single visual. When used correctly, they provide deep insights into how totals are built and where contributions come from.
Mastering stacked bar charts will significantly improve your Power BI reporting skills and help you create more insightful dashboards.