
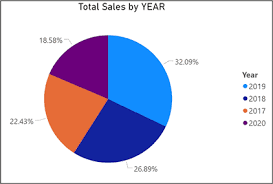
Pie charts are used to show proportions and percentages of a whole. They help viewers quickly understand how different categories contribute to a total. When used correctly, pie charts provide a simple and intuitive way to compare parts of a dataset.
This article explains how to create a pie chart in Power BI, when to use it, how to configure it properly, and best practices for professional reporting.
What Is a Pie Chart in Power BI?
A pie chart displays data as slices of a circle, where:
- Each slice represents a category
- The size of the slice represents its proportion of the total
In Power BI:
- Categories are placed in Legend
- Values are placed in Values
Pie charts are best for showing relative proportions, not precise comparisons.
When to Use a Pie Chart
Pie charts are most effective when:
- You want to show part-to-whole relationships
- The number of categories is small (2–6)
- Exact values are less important than proportions
Common Use Cases:
- Market share by brand
- Sales contribution by product
- Expense breakdown
- Customer distribution
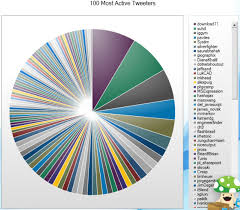
If there are too many categories, use a bar or column chart instead.
Preparing Your Data for a Pie Chart
Your dataset should have:
| Category | Value |
|---|---|
| Product A | 40 |
| Product B | 25 |
| Product C | 35 |
In Power BI:
- Category → text field
- Value → numeric field
Ensure:
- No duplicate categories (unless aggregation is intended)
- Data types are correct
- Values sum up meaningfully
Step-by-Step: How to Create a Pie Chart in Power BI
Step 1: Load Your Data
- Open Power BI Desktop
- Click Get Data
- Choose your data source
- Load the dataset
Step 2: Select the Pie Chart Visual
- Go to Report View
- In the Visualizations pane, select Pie Chart
Step 3: Assign Fields
- Drag Category → Legend
- Drag Value → Values
Power BI automatically calculates percentages.
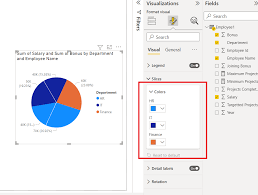
Formatting a Pie Chart for Better Clarity
Proper formatting makes pie charts more readable.
Key Formatting Options:
- Data labels: Show percentage and/or value
- Legend position: Right or bottom
- Slice colors: Use contrasting colors
- Detail labels: Category + percentage
Avoid using similar colors for adjacent slices.
Using Donut Charts as an Alternative
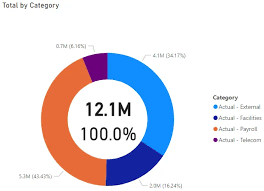
A Donut Chart is a variation of a pie chart with a hollow center.
When to Use:
- When you want to add a central label
- For a modern visual appearance
- When emphasizing proportions cleanly
To create one:
- Select Donut Chart instead of Pie Chart
- Assign the same fields
Adding Interactivity to Pie Charts
Enhance your pie charts with:
- Tooltips (hover for details)
- Slicers (filter by date, region, category)
- Cross-filtering with other visuals
Pie charts work well as overview visuals that interact with detailed charts.

Common Mistakes to Avoid
Avoid:
- Using too many slices
- Comparing similar-sized slices
- Using pie charts for trends
- Overloading labels
If exact comparison is required, use a bar chart instead.
Conclusion
Pie charts are excellent for showing proportions and part-to-whole relationships when used correctly. In Power BI, they are easy to create, visually intuitive, and effective for high-level summaries.
Understanding when and how to use pie charts ensures your dashboards remain clear, professional, and insightful.