
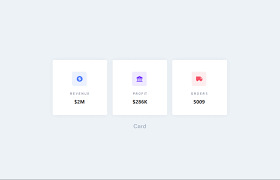
Card visuals are one of the simplest yet most powerful visuals in Power BI. They are used to display single, important values clearly and prominently. Card visuals are commonly placed at the top of dashboards to highlight key figures such as total sales, total customers, profit, or performance metrics.
This article explains how to create a Card visual in Power BI, when to use it, how to format it professionally, and best practices for effective dashboard design.
What Is a Card Visual in Power BI?
A Card visual displays one aggregated value derived from your dataset. It answers simple but critical questions such as:
- What is the total sales?
- How many customers do we have?
- What is the total profit?
- What is the average order value?
Card visuals focus attention on a single KPI or metric, making them ideal for high-level summaries.
When to Use a Card Visual
Use Card visuals when you want to:
- Highlight a single key metric
- Display totals, averages, or counts
- Provide quick insights at a glance
- Support KPI and dashboard summaries
Common Use Cases:
- Total Revenue
- Total Orders
- Average Sales
- Total Customers
- Profit Margin
Card visuals are best for summary information, not detailed breakdowns.
Preparing Your Data for a Card Visual
A Card visual requires one numeric value, usually created as a measure.
Example Measure:
Total Sales = SUM(Sales[Amount])
Other common measures:
Total Customers = DISTINCTCOUNT(Customers[CustomerID])
Average Order Value = AVERAGE(Orders[Amount])
Using measures ensures the card updates dynamically with filters and slicers.
Step-by-Step: How to Create a Card Visual in Power BI
Step 1: Load Your Data
- Open Power BI Desktop
- Click Get Data
- Load your dataset
Step 2: Create a Measure
- Go to Modeling
- Click New Measure
- Write your DAX formula
Step 3: Add the Card Visual
- Go to Report View
- Select Card from the Visualizations pane
- Drag your measure into the Fields well
Your card will immediately display the value.

Formatting a Card Visual for Clarity and Impact
Formatting helps make the card stand out.
Key Formatting Options:
- Callout value size (increase for emphasis)
- Display units (K, M, B)
- Decimal places
- Category label (on/off)
- Background and border
Use minimal design to maintain clarity.
Using Multiple Card Visuals Together
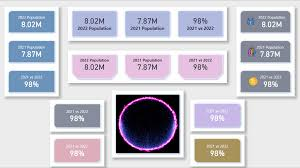
Multiple cards are often used together to summarize key metrics.
Example Cards:
- Total Sales
- Total Profit
- Total Orders
- Average Order Value
Align cards horizontally for a clean dashboard layout.
Dynamic Card Visuals with Filters and Slicers
Card visuals automatically respond to:
- Filters
- Slicers
- Cross-highlighting
Example:
- Add a Date slicer
- Select a specific month
- Card updates to reflect only that period
This makes cards interactive and context-aware.
Card Visual vs KPI Visual
| Feature | Card Visual | KPI Visual |
|---|---|---|
| Shows single value | Yes | Yes |
| Shows target | No | Yes |
| Shows trend | No | Yes |
| Simplicity | Very High | Medium |
Use Card visuals for quick numbers and KPI visuals for performance tracking.
Common Mistakes to Avoid
Avoid:
- Using cards for detailed metrics
- Overloading dashboards with too many cards
- Ignoring formatting consistency
- Displaying raw numbers without context
Cards should communicate value instantly.
Conclusion
Card visuals are essential for building clean, professional Power BI dashboards. They provide instant insights, highlight key metrics, and support decision-making at a glance.
Mastering Card visuals allows you to design dashboards that are simple, informative, and impactful.