
Power BI provides a wide range of visuals for presenting data, but raw charts and tables often need professional formatting to be truly effective. Proper formatting enhances readability, highlights important insights, and makes dashboards look polished.
This article explains how to format Power BI visuals, key techniques, and best practices for building professional, business-ready reports.
Why Formatting Matters
Formatting visuals in Power BI helps to:
- Improve clarity and readability
- Emphasize important data points
- Ensure consistency across visuals
- Make dashboards more professional and engaging
Even well-analyzed data can fail to communicate if visuals are poorly formatted.
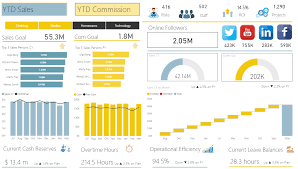
Formatting Charts — Bar, Column, and Line Charts
Key areas to format:
- Titles and Labels
- Add descriptive titles
- Use readable font sizes and styles
- Axis Formatting
- Label axes clearly
- Adjust scale and intervals
- Data Colors
- Use consistent color palettes
- Highlight important categories
- Data Labels
- Show or hide values depending on clarity
- Gridlines and Backgrounds
- Reduce clutter by removing unnecessary lines
- Add subtle background for contrast
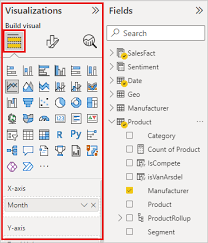
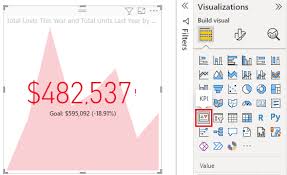
Formatting Cards and KPIs
Card and KPI visuals require simplicity:
- Increase data label font for focus
- Use consistent units (K, M, B)
- Apply conditional formatting if applicable
- Ensure contrast between text and background
These visual types are designed for quick insights, so clean formatting is critical.
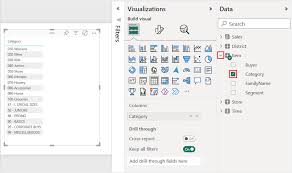
Tables and Matrix Formatting
Tables and matrices often display detailed data. Formatting tips:
- Adjust column width for readability
- Freeze important columns (like ID or Name)
- Enable row alternation colors to improve visibility
- Apply conditional formatting for metrics
Using Themes for Consistency
Power BI allows you to apply report themes:
- Standardize colors and fonts across all visuals
- Ensure consistent branding for corporate reports
- Import custom JSON themes for advanced styling
Consistency helps users interpret data quickly and creates a professional look.

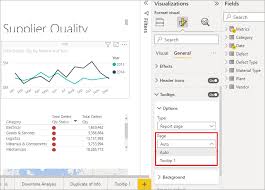
Customizing Legends and Tooltips
- Position legends to avoid overlapping visuals
- Use meaningful legend names
- Customize tooltips to provide extra insights without cluttering visuals
- Conditional tooltips can show dynamic measures
Best Practices for Formatting Visuals
- Simplify visuals — avoid overloading with too much data
- Use consistent colors and fonts — improves readability
- Highlight important information — via colors or bold text
- Maintain proportional sizing — larger visuals for key insights
- Test readability — check visuals for accessibility and screen size
Common Mistakes to Avoid
- Using too many colors or gradients
- Overcrowding charts or dashboards
- Neglecting axis labels and titles
- Inconsistent formatting across pages
- Ignoring conditional formatting opportunities
Correct formatting ensures visuals communicate insights efficiently.
Conclusion
Formatting visuals in Power BI is just as important as data analysis. Properly formatted charts, tables, and KPIs make dashboards clear, professional, and insightful. Mastering formatting not only improves aesthetics but also enhances decision-making by making data easier to interpret.