
Excel is one of the most powerful tools for data analysis, but its true strength lies in its functions. The right functions can help you clean data, analyze trends, automate calculations, and uncover insights much faster than manual work.
For data analysts, mastering a few core Excel functions can drastically improve productivity and accuracy.
In this article, we’ll cover 10 essential Excel functions every data analyst should know, what each function is used for, and practical ways to apply them.
1) SUM — Add Numbers Instantly
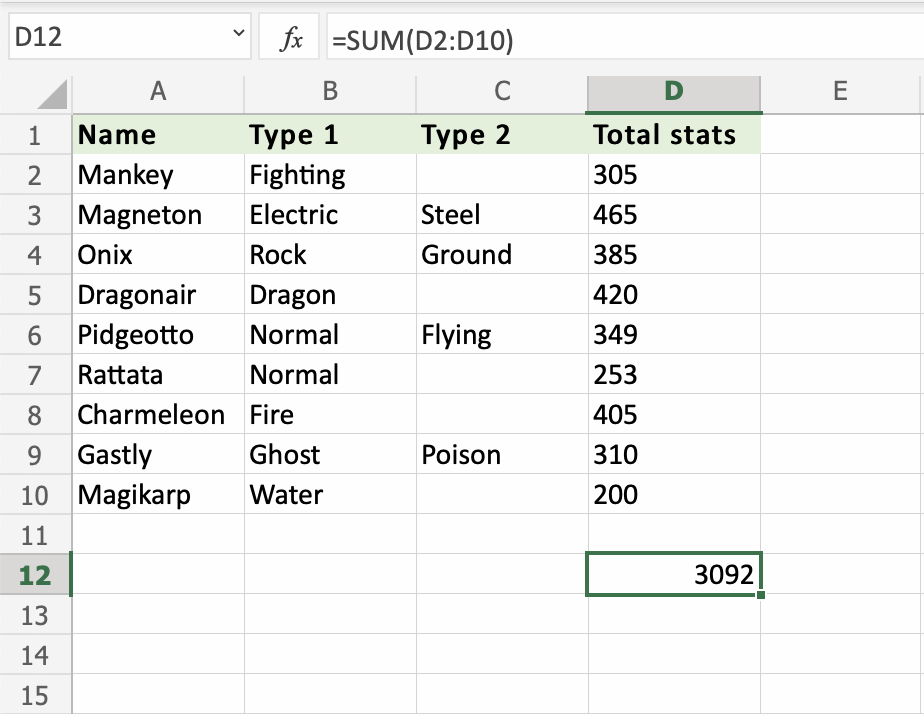
The SUM function is used to add numbers in a range of cells.
What it is used for
- Calculating total sales
- Summing expenses
- Adding quantities
Example
=SUM(B2:B100)
This adds all values from B2 to B100.
2) AVERAGE — Find Mean Values
The AVERAGE function calculates the arithmetic mean of a dataset.
What it is used for
- Average monthly sales
- Mean test scores
- Average customer spend
Example
=AVERAGE(C2:C100)
This calculates the average of the selected range.
3) IF — Add Decision Logic
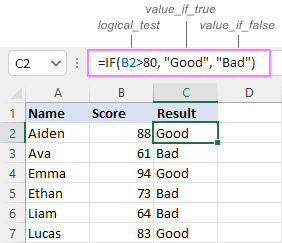
The IF function returns one value if a condition is true and another if it is false.
What it is used for
- Pass/fail logic
- Profit/loss labels
- Performance categories
Example
=IF(D2>=5000,"High","Low")
This labels values above 5000 as High.
4) COUNTIF — Count Based on Conditions
The COUNTIF function counts cells that meet a specific condition.
What it is used for
- Counting specific products
- Counting regions
- Frequency analysis
Example
=COUNTIF(A2:A100,"North")
This counts how many times North appears.
5) VLOOKUP — Traditional Lookup Function
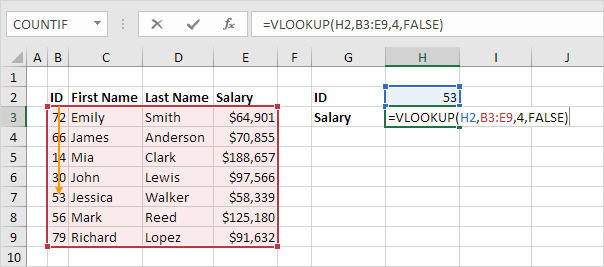
The VLOOKUP function searches vertically for a value and returns a matching result.
What it is used for
- Fetching product prices
- Employee names
- Customer information
Example
=VLOOKUP(E2,A2:C100,3,FALSE)
This looks up a value and returns the matching result from column 3.
6) INDEX + MATCH — Smarter Lookups
INDEX and MATCH are used together for more flexible lookups.
What it is used for
- Left-to-right and right-to-left lookups
- Large dataset searches
- Dynamic retrievals
Example
=INDEX(B2:B100,MATCH(E2,A2:A100,0))
This is often better than VLOOKUP.
7) TEXT — Format Values Professionally
The TEXT function changes how numbers or dates are displayed.
What it is used for
- Date formatting
- Currency display
- Custom report formatting
Example
=TEXT(A2,"dd-mmm-yyyy")
This formats a date into a readable style.
8) LEFT, RIGHT, MID — Extract Text
These text functions help split and clean text data.
What they are used for
- Extracting first names
- Pulling area codes
- Cleaning imported text
Example
=LEFT(A2,5)
This extracts the first 5 characters.
9) CONCAT / TEXTJOIN — Combine Text
These functions merge text from multiple cells.
What it is used for
- Full names
- Combined addresses
- Report labels
Example
=CONCAT(A2," ",B2)
This combines first and last names.
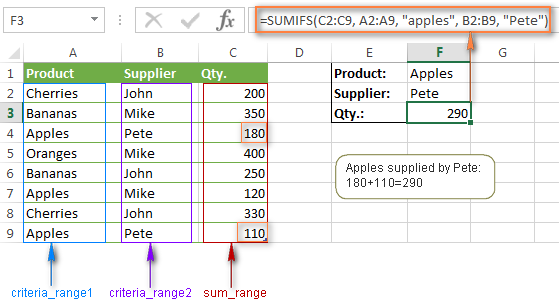
10) SUMIFS — Conditional Summation
The SUMIFS function sums values based on one or more conditions.
What it is used for
- Sales by region
- Revenue by product
- Expenses by month
Example
=SUMIFS(C2:C100,A2:A100,"North")
This sums values in C where A = North.
Best Practices for Using Excel Functions
To get the most out of Excel functions:
- Use named ranges where possible
- Keep formulas simple
- Audit formulas regularly
- Avoid hardcoding values
- Combine functions for advanced analysis
These habits improve accuracy and scalability.
Conclusion
Mastering these 10 Excel functions will dramatically improve your ability to analyze data, automate repetitive tasks, and create professional reports.
For data analysts, these functions are not just useful — they are foundational. Once you become comfortable with them, your workflow becomes faster, smarter, and far more efficient.