
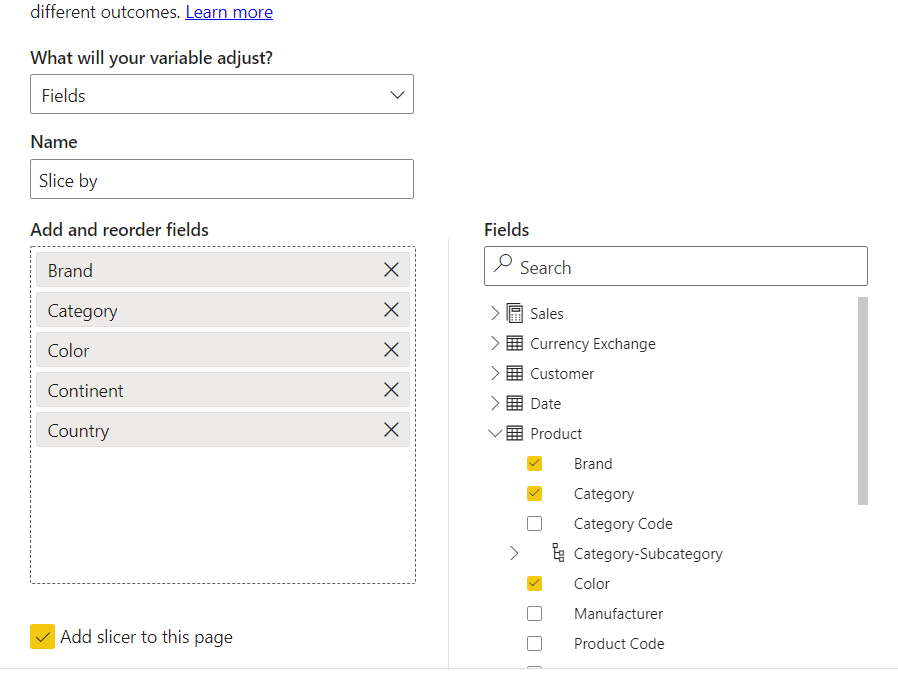
One of the newest and most powerful features in Power BI is Field Parameters. Most dashboards force users to view the same chart in the same way every time. Field Parameters allow users to choose what they want to see.
Instead of creating separate visuals for every metric or category, you can let users switch between them with a slicer.
This creates dashboards that feel interactive and flexible.
What Are Field Parameters?
Field Parameters allow users to dynamically change:
- Measures
- Dimensions
- Chart axes
- Categories shown in visuals
For example, one chart could switch between:
- Sales
- Profit
- Quantity Sold
Or users could change the category axis from:
- Region
- Product
- Customer Segment
All without creating multiple separate charts.
Why Field Parameters Are Better Than Multiple Charts
Many Power BI reports contain several nearly identical visuals:
- Sales by Region
- Profit by Region
- Quantity by Region
This wastes space and makes reports harder to use.
With Field Parameters, one chart can handle all three.
Benefits include:
- Cleaner dashboard layout
- Better user interaction
- Fewer visuals to maintain
- Faster report design
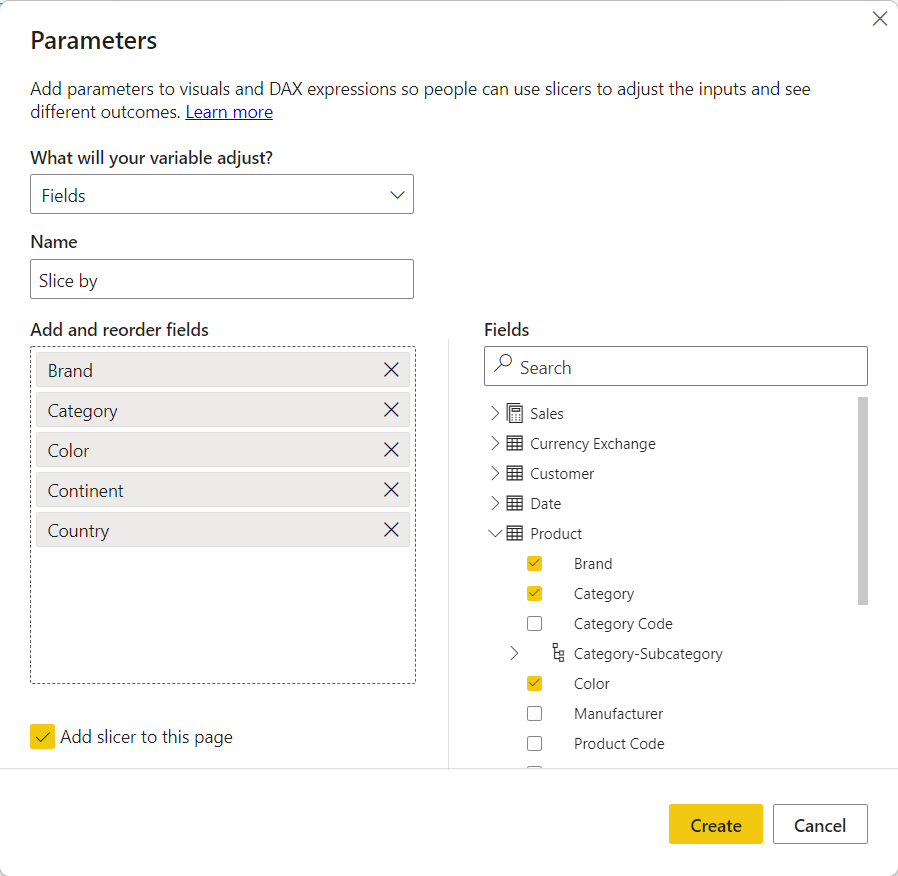
How to Create a Field Parameter
- Open Power BI Desktop
- Go to the Modeling tab
- Select “New Parameter” → “Fields”
- Choose the fields or measures you want users to switch between
- Name the parameter
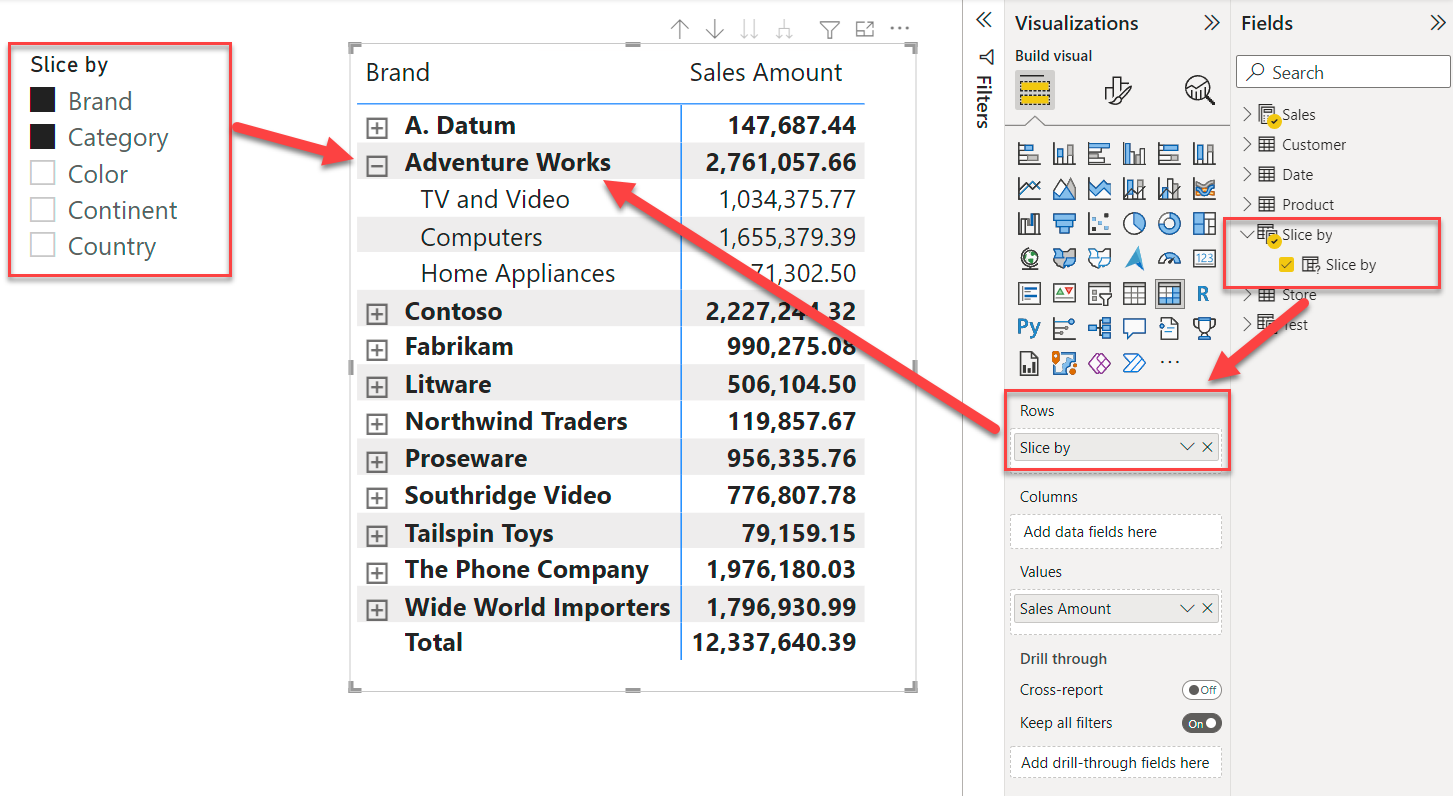
- Insert it into a visual and slicer
Power BI automatically creates a new table behind the scenes.
Example Scenario
Suppose you have a sales dashboard.
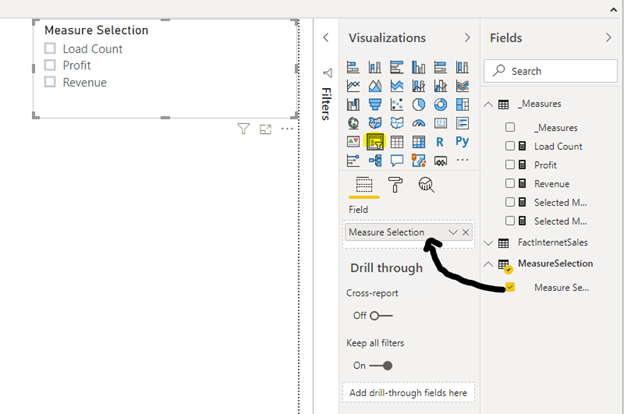
You create a parameter with these measures:
- Total Sales
- Profit
- Order Count
Then place the parameter into a column chart and add the parameter slicer.
Now users can choose which metric appears in the chart.
The same chart instantly changes without needing additional pages.
Advanced Use: Dynamic Axis Switching
You can also let users change the axis.
For example, one visual can show:
- Sales by Region
- Sales by Product
- Sales by Month
This is extremely useful for executive dashboards where different users want different perspectives.
Best Practices
To use Field Parameters effectively:
- Keep the number of options small
- Use clear labels
- Combine with slicers and bookmarks
- Test the report to ensure every option works correctly
Too many choices can make the report confusing.
Common Mistakes
- Adding too many fields to one parameter
- Using unclear names like “Measure 1”
- Forgetting to sort slicer options logically
- Mixing unrelated fields in the same parameter
The best field parameters feel simple and natural.
Conclusion
Field Parameters are one of the most powerful but underused features in Power BI. They make dashboards feel smarter because users can control what they see.
Instead of creating many repetitive visuals, you can build one flexible visual that adapts instantly.
For modern Power BI dashboards, Field Parameters are a game changer.