
Dashboards should be informative, but not cluttered. Adding too many visuals can overwhelm users.
Tooltips solve this problem by allowing you to show additional insights only when needed.
In Power BI, tooltips help you provide deeper context without taking up extra space.
What Are Tooltips?
Tooltips are small pop-up visuals that appear when a user hovers over a chart.
What they are used for
- Displaying additional metrics
- Providing detailed breakdowns
- Showing trends and comparisons

Default vs Custom Tooltips
Default Tooltips
Automatically show basic information like values.
Custom Tooltips
Allow you to design a separate report page.
Custom tooltips are more powerful and flexible.
Creating a Custom Tooltip Page
Steps:
- Create a new page
- Go to Format → Page Information
- Turn on Tooltip
- Set page size to Tooltip
Now design the page like a mini dashboard.
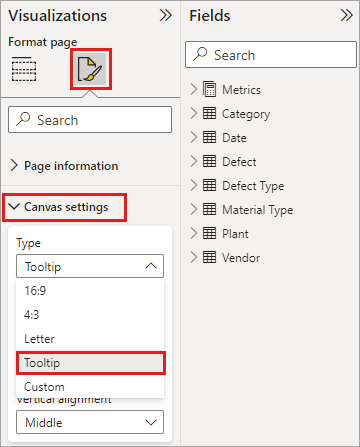
Assigning Tooltip to a Visual
- Select a visual
- Go to Format → Tooltip
- Choose your tooltip page
Now when users hover, they see additional insights.
Best Use Cases
- Showing product breakdowns
- Displaying trend charts
- Providing extra KPIs
- Adding explanations
Best Practices
- Keep tooltip simple
- Use small visuals
- Avoid overcrowding
- Focus on key insights
Common Mistakes
- Making tooltips too complex
- Adding unnecessary visuals
- Ignoring readability
Conclusion
Tooltips enhance dashboards by adding depth without clutter. They create a cleaner, more interactive experience for users.