
Good Afternoon.
How has been your day?
Today, I want to teach you how to apply what is known as conditional formatting.
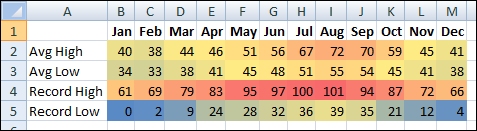
By applying conditional formatting to your data, you can quickly identify variances in a range of values with a quick glance. This the main reason (among others) for applying formatting to your work.
This graphic shows temperature data with conditional formatting that uses a color scale to differentiate high, medium, and low values. The following procedure uses that data.
How then can you do this?
| Select the data that you want to conditionally format |
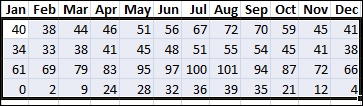
| Apply the conditional formatting
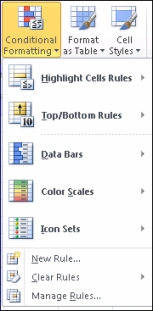
1. On the Home tab, in the Styles group, click the arrow next to Conditional Formatting, and then click Color Scales. 2. Hover over the color scale icons to see a preview of the data with conditional formatting applied. In a three-color scale, the top color represents higher values, the middle color represents medium values, and the bottom color represents lower values. This example uses the Red-Yellow-Blue color scale. |

| Experiment with the conditional formatting
On the Home tab, in the Styles group, click the arrow next to Conditional Formatting, and then experiment with the available styles.
|
Next steps
- After you have applied a style, select your data, click Conditional Formatting on the ribbon, and then click Manage Rules to manually fine-tune your rules and formatting.