

Good Afternoon.
How has been your day?
I will like to open your eyes to an aspect of powerpoint today.
It is called organisation chart.
You might have been wondering how people create their charts. You know what you too can do same with the help of Microsoft Excel.
You can also create an organization chart with a picture associated with each person in the SmartArt graphic. An organization chart with photos not only looks professionally designed, but will also help the audience associate the names and faces of their colleagues.
I have simplified this lesson into ten sub heads so as to enhance better understanding of the content at the end.
Here are the sub heads:
Overview of creating an organization chart
Create an organization chart with pictures
Add or delete boxes in your organization chart
Change a solid line to a dotted line
Change the hanging layout of your organization chart
Change the colors of your organization chart
Change the background color of a box in your organization chart
Apply a SmartArt Style to your organization chart
Animate your organization chart
Now, let’s start!
Overview of creating an organization chart
An organization chart graphically represents the management structure of an organization, such as department managers and nonmanagement employees within a company. By using a SmartArt graphic in Excel, Outlook, PowerPoint, or Word, you can create an organization chart and include it in your worksheet, e-mail message, presentation, or document. To create an organization chart quickly and easily, you can type or paste text in your organization chart and then have the text automatically positioned and arranged for you.
When you add an assistant box to an organization chart layout, such as Organization Chart, a bullet with a line attached indicates the assistant box in the Text pane.
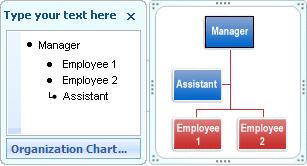
Although you can use other hierarchy layouts to create an organization chart, the assistant box and the hanging layouts are available only with organization chart layouts.
To quickly add a designer-quality look and polish to your SmartArt graphic, you can change the colors or apply a SmartArt Style to your organization chart. In PowerPoint 2010 presentations, you can also animate your organization chart.
Create an organization chart
- In your document, presentation, spreadsheet, or e-mail message, on the Insert tab, in the Illustrations group, click SmartArt.
- In the Choose a SmartArt Graphic gallery, click Hierarchy, click an organization chart layout (such as Organization Chart), and then click OK.
- To enter your text, do one of the following:
- Click in a box in the SmartArt graphic, and then type your text.
Note For best results, use this option after you add all of the boxes that you want.
- Click [Text] in the Text pane, and then type your text.
- Copy text from another location or program, click [Text] in the Text pane, and then paste your text.
Note If the Text pane is not visible, click the control.
Create an organization chart with pictures
- In your document, presentation, spreadsheet, or e-mail message, on the Insert tab, in the Illustrations group, click SmartArt.
- In the Choose a SmartArt Graphic gallery, click Hierarchy, and then double-click Picture Organization Chart.
- To add a picture, in the box where you want to add the picture, click the picture icon, locate the folder that contains the picture that you want to use, click the picture file, and then click Insert.
A picture icon
- To enter your text, do one of the following:
- Click in a box in the SmartArt graphic, and then type your text.
Note For best results, use this option after you add all of the boxes that you want.
- Click [Text] in the Text pane, and then type your text.
- Copy text from another location or program, click [Text] in the Text pane, and then paste your text.
Note If the Text pane is not visible, click the control.
Add or delete boxes in your organization chart
Add a box
- Click the SmartArt graphic that you want to add a box to.
- Click the existing box that is located closest to where you want to add the new box.
- Under SmartArt Tools, on the Design tab, in the Create Graphic group, click the arrow under Add Shape, and then do one of the following:
Note If you do not see the SmartArt Tools or Design tabs, make sure that you have selected the SmartArt graphic. You may have to double-click the SmartArt graphic to select it and open the Design tab.
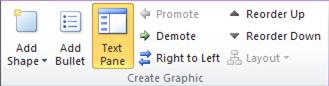
- To insert a box at the same level as the selected box but following it, click Add Shape After.
- To insert a box at the same level as the selected box but before it, click Add Shape Before.
- To insert a box one level above the selected box, click Add Shape Above.
The new box takes the position of the selected box, and the selected box and all the boxes directly below it are each demoted one level.
- To insert a box one level below the selected box, click Add Shape Below.
- To add an assistant box, click Add Assistant.
The assistant box is added above the other boxes at the same level in the SmartArt graphic, but it is displayed in the Text pane after the other boxes at the same level.
Add Assistant is available only for organization chart layouts. It is not available for hierarchy layouts, such as Hierarchy.
Delete a box
To delete a box, click the border of the box you want to delete, and then press DELETE.
Notes
- When you need to add a box to your relationship graphic, experiment with adding the shape before or after the selected shape to get the placement you want for the new shape.
- To add a shape from the Text pane:
- At the shape level, place your cursor at the end of the text where you want to add a new shape.
- Press ENTER, and then type the text that you want in your new shape.
- To add an assistant box, press ENTER while an assistant box is selected in the Text pane.
- Although you cannot automatically connect two top-level boxes with a line in the organization chart layouts, such as Organization Chart, you can imitate this look by adding a box to the top level to your SmartArt graphic and then drawing a line to connect the boxes.
- To move a box, click the box that you want to move and then drag the box to its new location. To move or “nudge” the box in very small increments, hold down CTRL while you press the arrow keys on your keyboard.
Change a solid line to a dotted line
To show a dotted-line reporting relationship between two boxes, change the style of the line between the two boxes.
- Click the SmartArt graphic whose line you want to change.
- Right-click the line, and then click Format Shape on the shortcut menu.
- Click Line Style, and then select the Dash type that you want.
Change the hanging layout of your organization chart
A hanging layout affects the layout of all boxes below the selected box.
- Click the box in the organization chart that you want to apply a hanging layout to.
- Under SmartArt Tools, on the Design tab, in the Create Graphic group, click Layout, and then do one of the following:
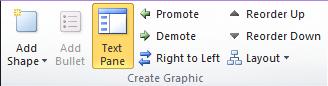
Note If you do not see the SmartArt Tools or Design tabs, make sure that you have selected a SmartArt graphic. You may have to double-click the SmartArt graphic to select it and open the Design tab.
- To center all of the boxes below the selected box, click Standard.
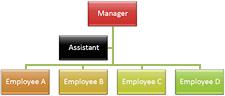
- To center the selected box above the boxes below it and arrange the boxes below it horizontally with two boxes in each row, click Both.
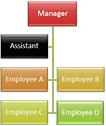
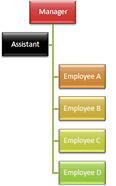
- To arrange the selected box to the right of the boxes below it and left-align the boxes below it vertically, click Left Hanging.
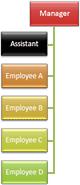
- To arrange the selected box to the left of the boxes below it and right-align the boxes below it vertically, click Right Hanging.
Change the colors of your organization chart
You can apply color combinations that are derived from the theme colors (theme colors: A set of colors that is used in a file. Theme colors, theme fonts, and theme effects compose a theme.) to the boxes in your SmartArt graphic.
- Click the SmartArt graphic whose color you want to change.
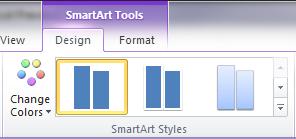
- Under SmartArt Tools, on the Design tab, in the SmartArt Styles group, click Change Colors.
If you do not see the SmartArt Tools or Design tabs, make sure that you have selected a SmartArt graphic. You may have to double-click the SmartArt graphic to select it and open the Design tab.
- Click the color combination that you want.
Tip When you place your pointer over a thumbnail, you can see how the colors affect your SmartArt graphic.
Change the background color of a box in your organization chart
- Right-click the border of a box, and then click Format Shape on the shortcut menu.
- Click the Fill pane, and then click Solid fill.
- Click Color , and then click the color that you want.
- To specify how much you can see through the background color, move the Transparency slider, or enter a number in the box next to the slider. You can vary the percentage of transparency from 0% (fully opaque, the default setting) to 100% (fully transparent).
Apply a SmartArt Style to your organization chart
Applies only to PowerPoint
A SmartArt Style is a combination of various effects, such as line style, bevel, or 3-D, that you can apply to the boxes in your SmartArt graphic to create a unique and professionally designed look.
- Click the SmartArt graphic whose SmartArt Style you want to change.
- Under SmartArt Tools, on the Design tab, in the SmartArt Styles group, click the SmartArt Style that you want.
To see more SmartArt Styles, click the More button .
If you do not see the SmartArt Tools or Design tabs, make sure that you have selected a SmartArt graphic. You may have to double-click the SmartArt graphic to select it and open the Design tab.
Notes
- When you place your pointer over a thumbnail, you can see how the SmartArt Style affects your SmartArt graphic.
- You can also customize your SmartArt graphic by moving boxes, resizing boxes, and Change the SmartArt graphic shape fill or shape border.
Animate your organization chart
If you’re using PowerPoint, you can animate your organization chart to emphasize each box, each branch, or each hierarchical level.
- Click the SmartArt graphic organization chart that you want to animate.
- On the Animations tab, in the Advanced Animation group, click Add Animation and select the animation effect that you want.
- To change the animation on your organization chart to occur by level, such as to make all shapes at the same level appear together but before shapes at a lower level, do the following:
- Select the organization chart.
- On the Animations tab, in the Animation group, click Effect Options and select Level One by One.

Note If you copy an organization chart that has an animation applied to it to another slide, the animation is also copied.
Thanks for taking this lesson.
Mind you, your questions are highly welcome.