
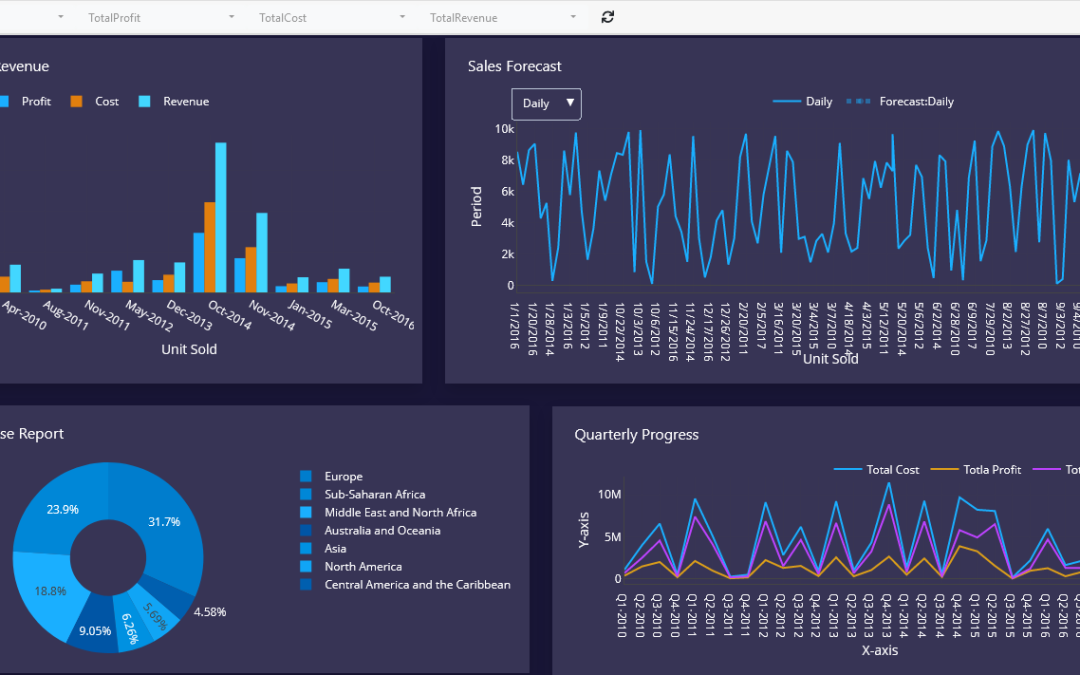
Data without presentation is just numbers.
The most valuable data analysis means little if results are buried in spreadsheets that stakeholders never see or cannot interpret.
Charts, graphs, and dashboards translate raw data into visual stories that drive decisions.
The problem is that creating and updating visualizations manually is time-consuming. Every time the underlying data changes, someone has to regenerate charts, reformat them, and distribute updated reports.
Python solves this by automating the entire visualization process, from data retrieval to chart generation to report delivery.
Why Automate Data Visualization?
In many organizations, reporting is a weekly ritual.
An analyst pulls data, builds charts in Excel, copies them into a presentation, and emails the file to management.
This cycle repeats every week.
Automated visualization changes this entirely. Python can:
- Retrieve the latest data automatically
- Generate updated charts without manual input
- Export visual reports as PDF or image files
- Integrate with tools like Excel and Power BI for seamless delivery
Benefits of Automated Visualization
- Reports are always current without additional effort
- Consistent chart formatting across all outputs
- Time saved on repetitive reporting tasks
- Faster insight delivery to decision-makers
Core Python Libraries for Data Visualization
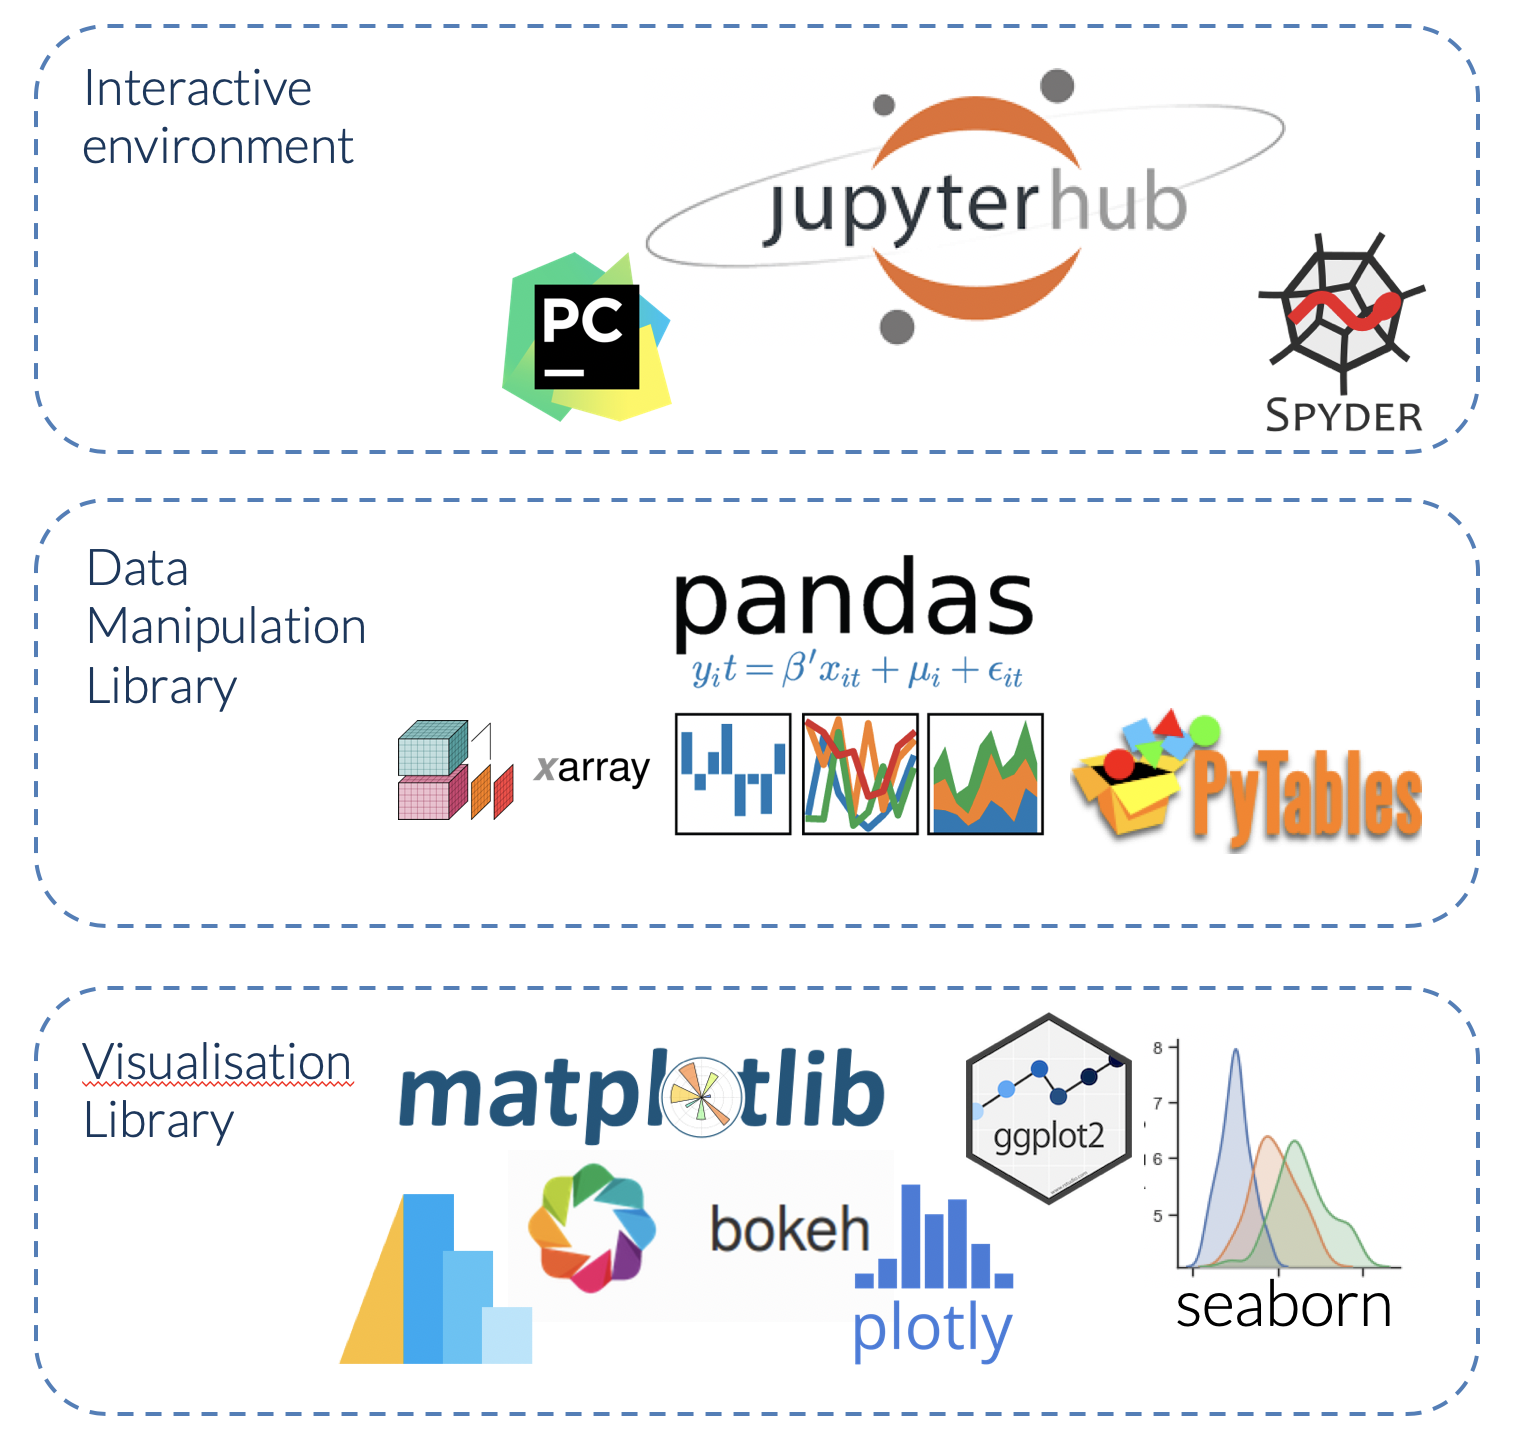
Several libraries make chart generation straightforward in Python.
Matplotlib
Matplotlib is the foundational visualization library in Python.
python
import matplotlib.pyplot as pltWhat It Is Used For
- Line charts, bar charts, pie charts, scatter plots
- High-quality static image exports
- Full control over chart appearance
Seaborn
Seaborn builds on Matplotlib and produces statistically oriented visuals with cleaner default styling.
python
import seaborn as snsWhat It Is Used For
- Distribution plots, heatmaps, pair plots
- Statistical summaries embedded in charts
Plotly
Plotly generates interactive charts that work in web browsers and dashboards.
python
import plotly.express as pxWhat It Is Used For
- Interactive bar charts, line graphs, maps
- Dashboard integration
- Hover-enabled data exploration
Generating a Bar Chart Automatically
Suppose sales data is stored in a CSV file that updates daily.
Python can read the file and generate an updated chart automatically.
python
import pandas as pd
import matplotlib.pyplot as plt

df = pd.read_csv("monthly_sales.csv")

plt.bar(df["month"], df["revenue"])
plt.title("Monthly Revenue")
plt.xlabel("Month")
plt.ylabel("Revenue ($)")
plt.tight_layout()
plt.savefig("monthly_revenue_chart.png")
What This Does
- Reads the latest sales data from a CSV file
- Generates a bar chart
- Saves the chart as an image file automatically
Generating a Line Chart for Trends
Line charts are effective for showing data over time.
python
plt.plot(df["date"], df["units_sold"])
plt.title("Daily Units Sold")
plt.xlabel("Date")
plt.ylabel("Units")
plt.savefig("units_trend.png")
What This Does
Produces a trend line chart showing how sales volume changes day by day.
Exporting Visual Reports
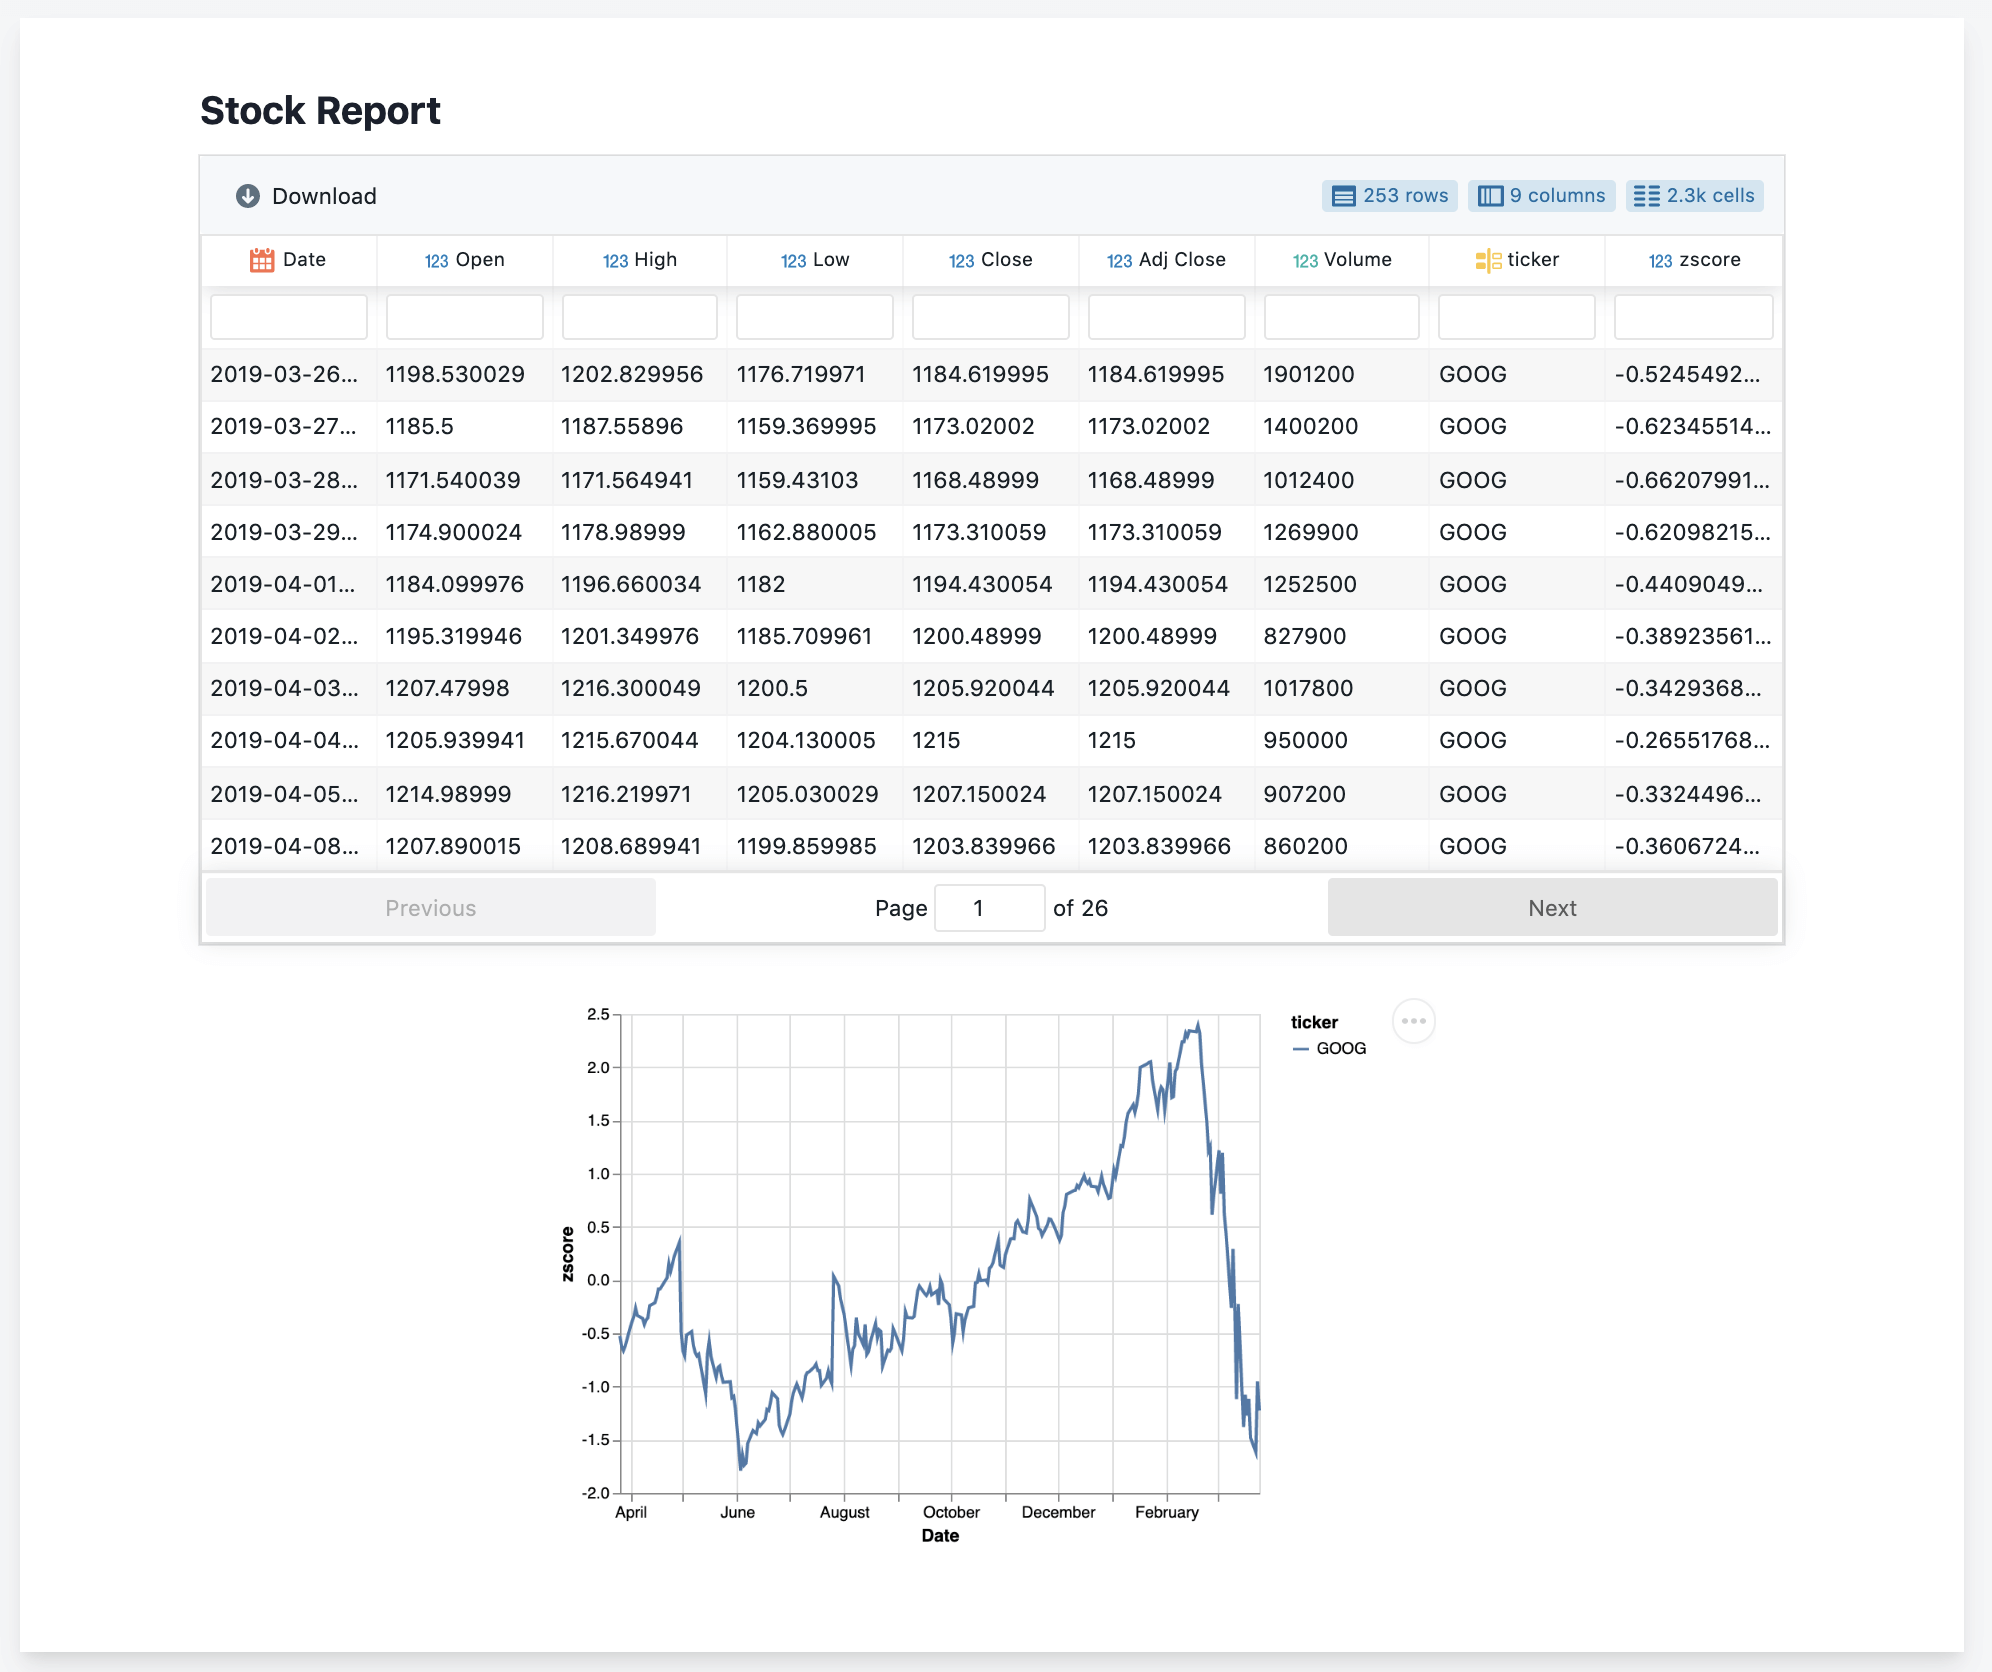
Charts can be exported in multiple formats for distribution.
Saving as PNG or PDF
python
plt.savefig("report_chart.png", dpi=150)

plt.savefig("report_chart.pdf")
What This Does
- PNG files are suitable for emails and presentations
- PDF exports maintain quality for printed reports
Combining Multiple Charts into One Report
python
fig, axes = plt.subplots(2, 2, figsize=(12, 8))

axes[0, 0].bar(df["month"], df["revenue"])
axes[0, 1].plot(df["date"], df["units_sold"])

plt.suptitle("Monthly Performance Report")
plt.tight_layout()
plt.savefig("full_report.pdf")
What This Does
Creates a multi-chart layout and exports all visuals as a single PDF.
Integrating with Excel
Python can embed charts directly into Excel workbooks using the openpyxl or xlsxwriter libraries.
python
import pandas as pd

writer = pd.ExcelWriter("report.xlsx", engine="xlsxwriter")
df.to_excel(writer, sheet_name="Sales Data", index=False)
writer.close()
What This Does
Exports the data into an Excel file, which can then be opened with embedded charts already formatted.
Integrating with Power BI
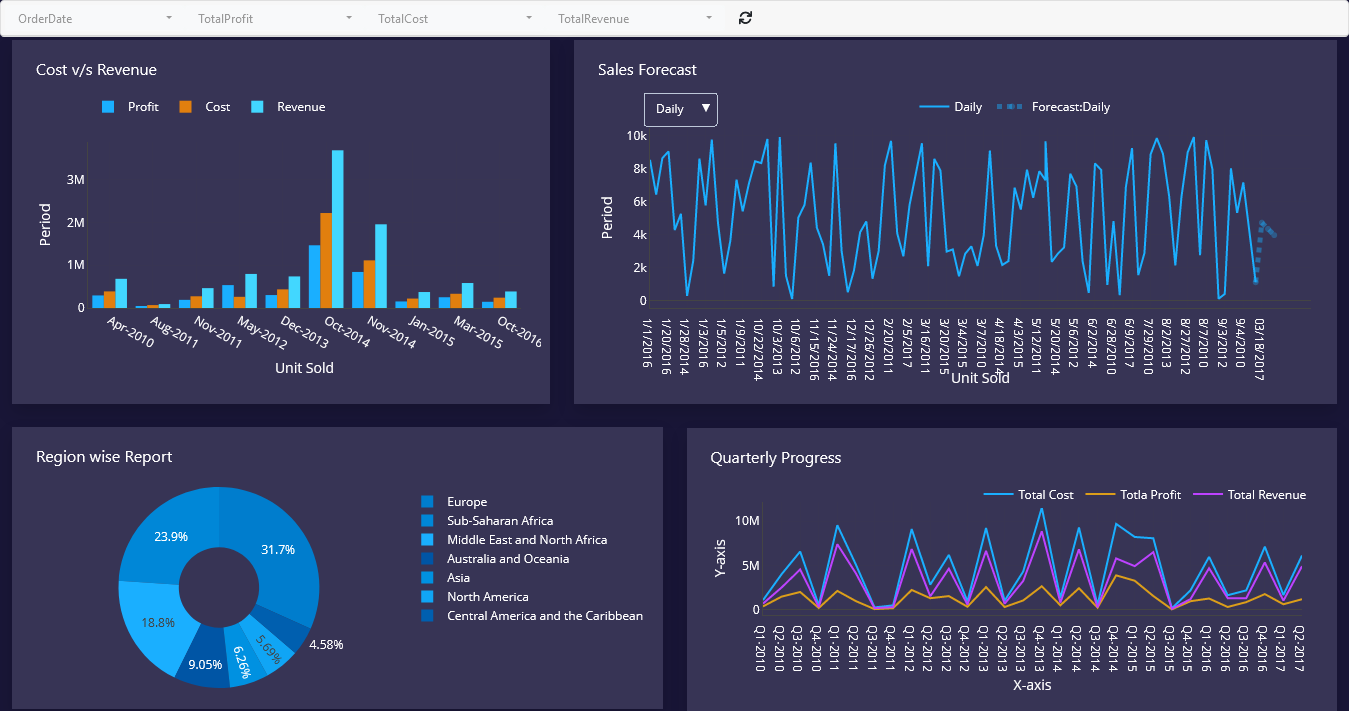
Power BI can connect directly to Python scripts as a data source.
This means a Python script can clean and transform data, and Power BI will use the output to update dashboards automatically whenever the report is refreshed.
Steps to Connect Python to Power BI
- Open Power BI Desktop
- Select Get Data → Python Script
- Paste the Python script that outputs a DataFrame
- Power BI will use the DataFrame as its data source
This integration allows Python’s data processing capabilities to feed directly into Power BI’s visualization layer.
Creating Recurring Dashboard Updates
By combining Python visualization scripts with scheduling tools, dashboards can be refreshed automatically on a daily, weekly, or monthly basis.
A typical automated dashboard workflow looks like this:
- A cron job or Task Scheduler triggers the Python script
- The script pulls fresh data from the database or API
- Charts and reports are generated and saved
- Updated files are emailed to recipients or uploaded to a shared drive
Best Practices
- Use consistent color palettes and fonts across all charts
- Label axes and add titles to every visualization
- Save charts in a standardized folder with date-stamped filenames
- Test chart generation with sample data before scheduling
- Keep chart scripts modular so individual charts can be updated without affecting others
Conclusion
Automating data visualization removes the manual effort of generating and distributing reports. With Python libraries such as Matplotlib, Seaborn, and Plotly, data professionals can build scripts that generate publication-ready charts automatically, export them in multiple formats, and integrate with tools like Excel and Power BI.
When visualization is automated, teams always have access to up-to-date insights without waiting for someone to manually refresh a report.