

A dashboard in Excel gives a compact visual representation of information. These are specially designed to be interactive, easy to understand and concise. Experts can easily extract useful insights from this representation. These contain many elements like raw numbers, characters, tables and different types of charts.
Why Use a Dashboard in Excel?
A dashboard in Excel is used for many applications. It represents a consolidated and visual overview of data from different sources in a single plane. Experts use this view to detect trends, oversee performance and make informed decisions. They do not have to explore humongous datasets while using these dashboard.
Key Benefits of Using a Dashboard in Excel
- Visual Data Interpretation – It uses charts and graphs to display complicated data effectively. This makes it easy to understand patterns and trends at a glance.
- Interactive Analysis – Features like filters and slicers lets users dynamically manipulate information. They can explore different scenarios and explore every detail to make informed decisions.
- Centralized View – It combines data from different sources to a single dashboard. This eliminates the requirement of switching between multiple spreadsheets.
- Customizable Design – Individuals can design the visuals according to their requirements. They can change dashboard layout, metrics and color based on needs and priorities.
How to Create an Interactive Dashboard in Excel?
Creating a dashboard in Excel involves many steps including organizing data, using pivot tables, creating pivot charts and adding interactive elements.
Step 1 – Prepare the Data
Clean and organized data is the foundation of dashboards. These dashboards are meaningless and can not give important insights without structured data. Data is structured with the following steps.
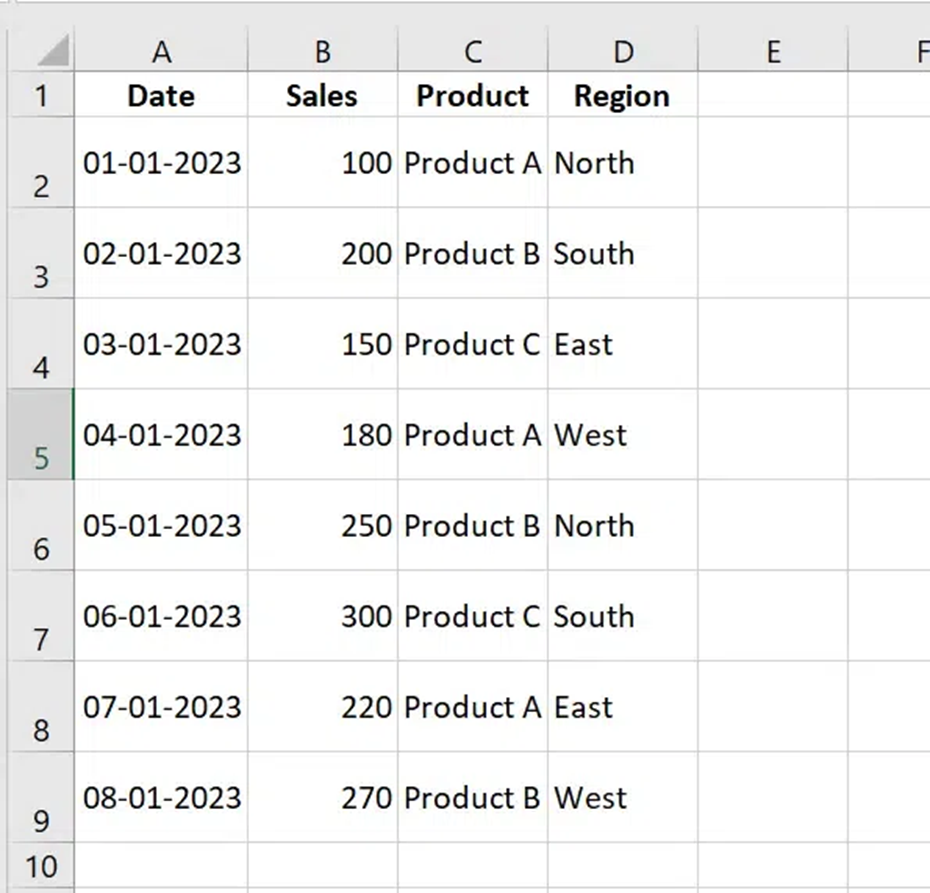
Start from organizing data in the form of tables using rows and columns with clear headers like date, sales, product and region.
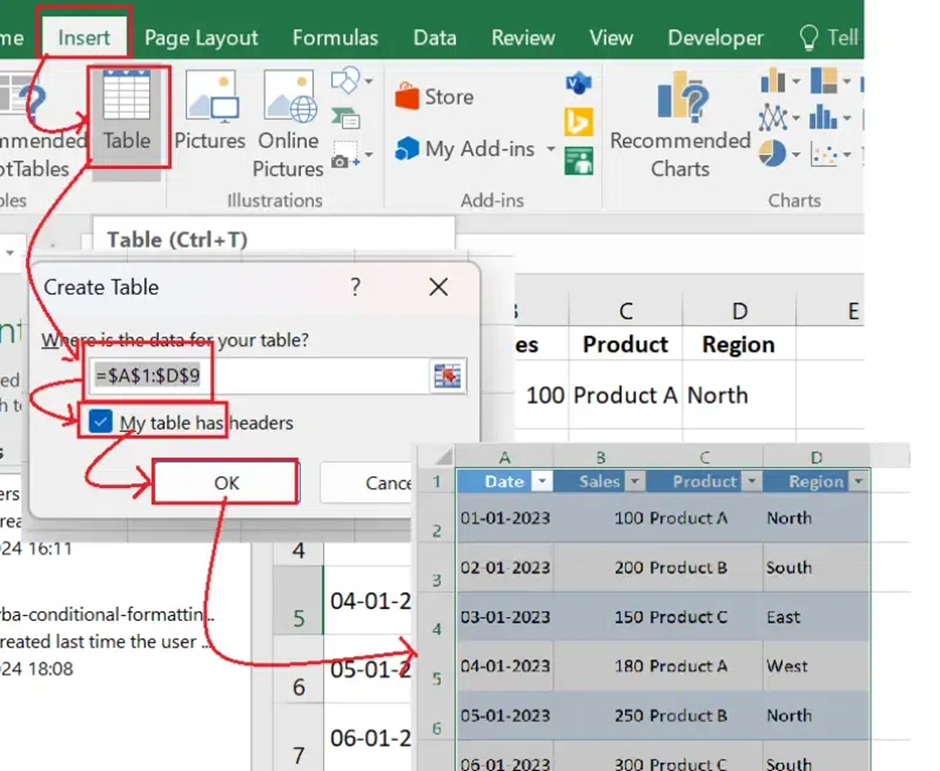
Now select the data, go to Insert Table and select My table has headers option.
Use Data Remove Duplicates to remove all duplicate entries from the table.
Step 2 – Plan the Dashboard Layout
Now it is time to plan a layout for the dashboard. This involves selecting different elements like KPIs, Charts and interactive filters. KPIs highlight all key metrics including total sales, growth percentages and average revenue. Charts visualize trends using different visuals like bar, line or pie. Filters like slicers or dropdowns give dynamic features.
Step 3 – Insert Pivot Tables
PivotTables work as the backbone for most dashboards. They can summarize and analyze humongous data sets quickly. Creating a pivot table involves selecting table > clicking on insert PivotTable, choosing a space to in the worksheet and dragging filters to the PivotTable.
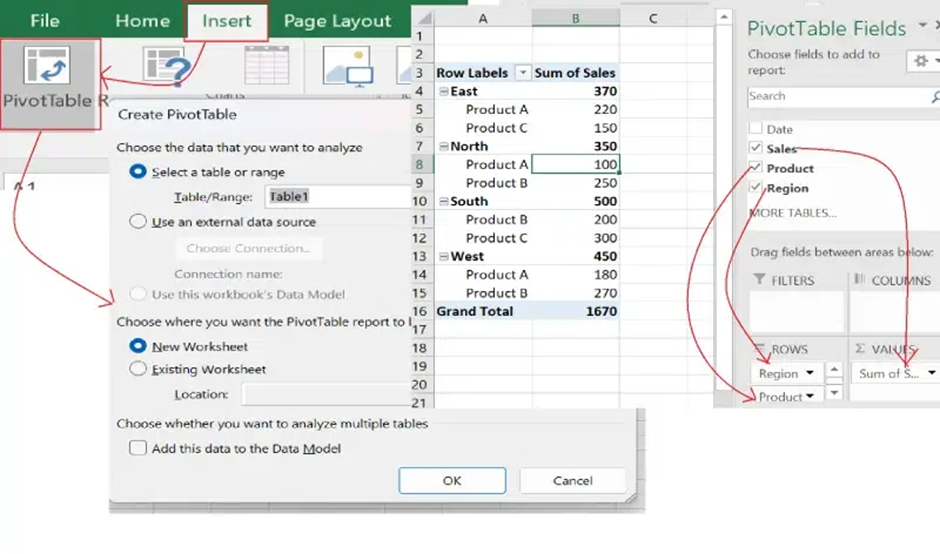
Step 4 – Add Charts for Data Visualization
Now add charts to transform raw data into visual insights. This lets users easily track trends and patterns to make informed decisions. Select the PivotTable and click on the Insert Chart option. There are many options available to select from like Column, Line, Pie and more.
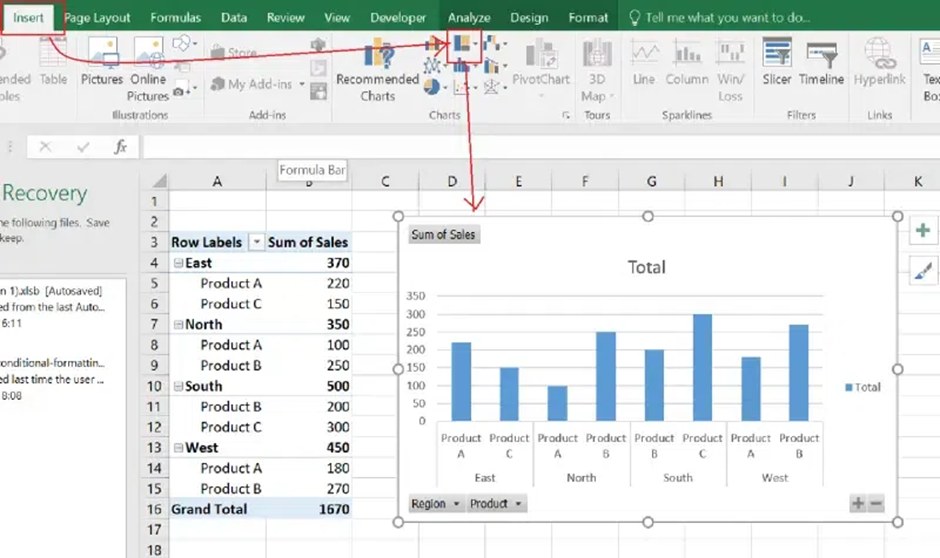
Step 5 – Add Interactive Filters
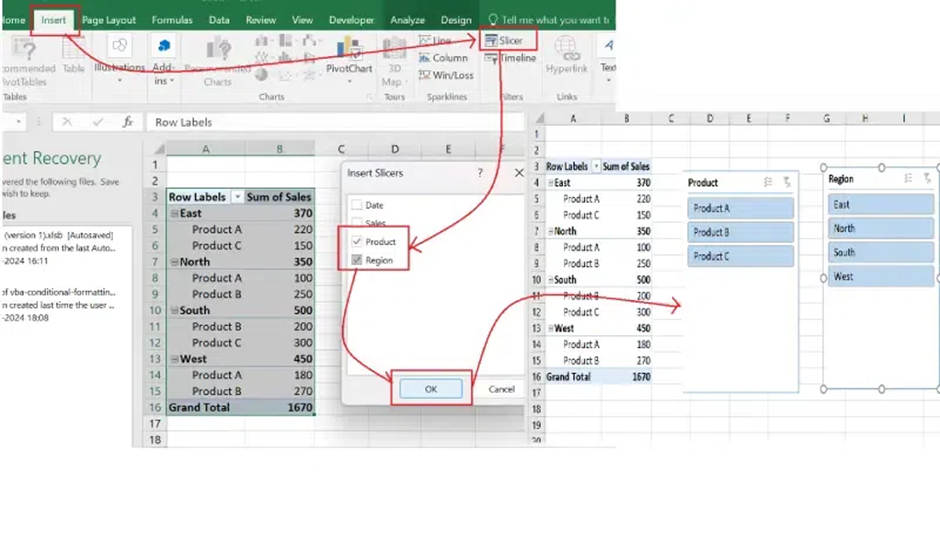
Use of interactive filters creates user friendly dashboards. Viewers can focus on specific data points once they implement filters to dashboards. This involves selecting PivotTable > choosing the Insert Slicer option > selecting fields to filter > resizing slicers on the dashboard > and position them.
Step 6 – Format & Design the Dashboard
The simplicity of dashboards depends on its presentation and designing. More appealing designs are often easy to understand. Use the following tips to create an interactive template –
- Consistent Colors – Implements a uniform color palette for each element including charts, shapes and text.
- Grid Alignment – Use gridlines and alignment tools in order to poison elements neatly.
- Minimalist Design – Avoid clutter by using only important elements.
- Add Titles and Labels – Label each section and chart neatly.
Step 7 – Test & Finalize the Dashboard
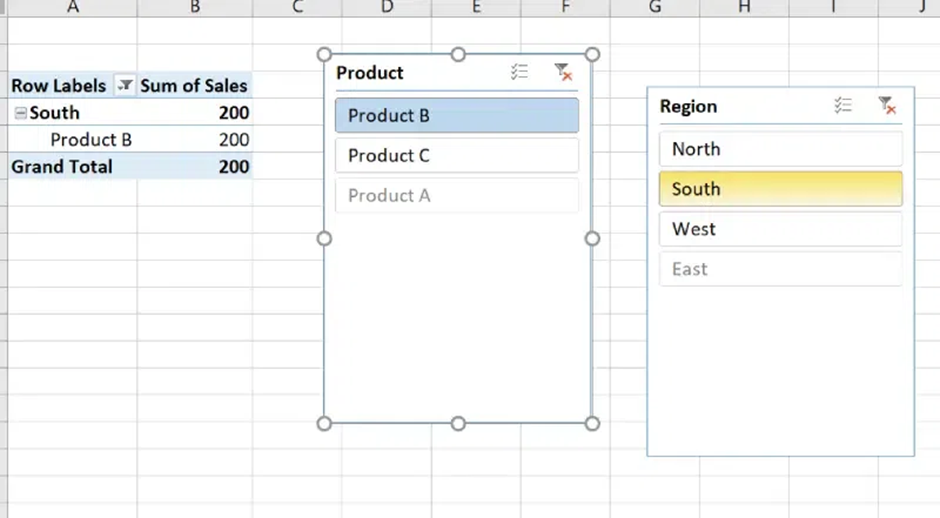
It is important to test the functionality before sharing the dashboards with the team. Just check that each chart and KPIs update dynamically with filters. Check all the formulas added in the workflow. There is an option namely Protect Sheet in the Review section. It can set passwords to prevent fortuitous edits.
