
Most beginners use normal ranges, but professionals use Excel Tables.
What is an Excel Table?
Excel table is a named object that allows you to manage its contents independently from the rest of the worksheet data.
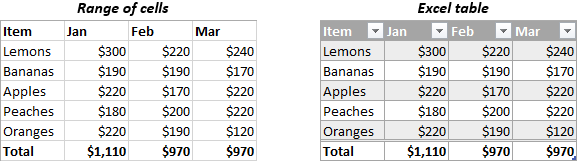
Typically, a table contains related data that are entered in a series of rows and columns, though it can consist of a single row and/or column. The screenshot below shows a difference between a usual range and a table:
How to make a table in Excel
Sometimes, when people enter related data in a worksheet, they refer to that data as a “table”, which is technically incorrect. To convert a range of cells into a table, you need to explicitly format it as such. As is often the case in Excel, there is more than one way to do the same thing.
3 ways to create a table in Excel
To insert a table in Excel, organize your data in rows and columns, click any single cell within your data set, and do any of the following:
- On the Insert tab, in the Tables group, click Table. This will insert a table with the default style.

- On the Home tab, in the Styles group, click Format as Table, and select one of the predefined table styles.
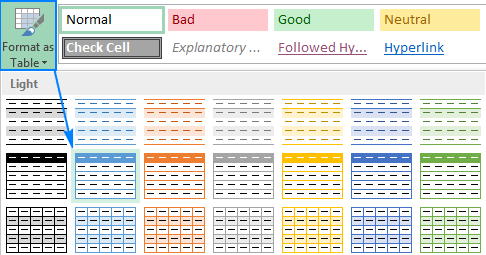
- If you prefer working from the keyboard rather than using a mouse, the fastest way to create a table is pressing the Excel Table shortcut: Ctrl+T
Whatever method you choose, Microsoft Excel automatically selects the entire block of cells. You verify if the range is selected correctly, check or uncheck the My table has headers option, and click OK.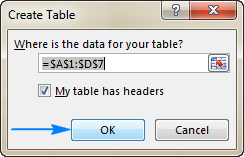
As the result, a nicely formatted table is created in your worksheet. At first sight, it may look like a normal range with the filter buttons in the header row, but there is much more to it!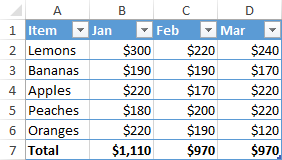
Benefits
- Auto-expanding
- Structured references
- Built-in filters
Conclusion
Tables make Excel smarter and easier to manage.