

Bar charts are one of the most commonly used visuals in Power BI. They are ideal for comparing values across categories and are especially effective when category names are long or when you want clear, easy-to-read comparisons.
This article provides a complete, beginner-to-intermediate guide on how to create a bar chart in Power BI, including when to use it, how to configure it properly, and best practices for professional reporting.
What Is a Bar Chart in Power BI?
A bar chart displays data using horizontal bars, where:
- The length of each bar represents a value
- Each bar corresponds to a category
In Power BI, bar charts are particularly useful when:
- Comparing multiple categories
- Working with long category labels
- Presenting rankings clearly
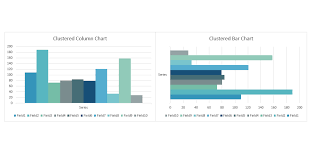
Bar charts differ from column charts mainly in orientation — bar charts are horizontal, while column charts are vertical.
When to Use a Bar Chart
Bar charts are best used when you want to:
- Compare values across different categories
- Rank items from highest to lowest
- Display clear differences between groups
- Improve readability for long text labels
Common Use Cases:
- Sales by product
- Revenue by region
- Customer count by category
- Performance comparison across departments
Using a bar chart makes comparisons intuitive and visually clean.
Preparing Your Data for a Bar Chart
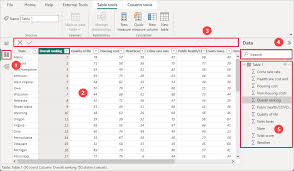
Before creating a bar chart, ensure your data is properly structured.
Typical Data Structure:
| Category | Value |
|---|---|
| Product A | 120 |
| Product B | 95 |
| Product C | 150 |
In Power BI:
- Categories should be text fields
- Values should be numeric fields
If needed, clean your data using Power Query:
- Remove duplicates
- Fix data types
- Rename columns
Proper data preparation ensures accurate visuals.
Step-by-Step: How to Create a Bar Chart in Power BI
Follow these steps to create a bar chart from scratch:
Step 1: Load Your Data
- Open Power BI Desktop
- Click Get Data
- Select your data source (Excel, SQL Server, CSV, etc.)
- Load the dataset
Step 2: Select the Bar Chart Visual
- Go to Report View
- In the Visualizations pane, click Bar Chart
- (Choose Clustered Bar Chart for most cases)
Step 3: Assign Fields
- Drag your Category field → Y-Axis
- Drag your Numeric field → X-Axis
- (Optional) Drag another category → Legend
Your bar chart will appear automatically.
Formatting a Bar Chart for Better Readability
Formatting improves clarity and professionalism.
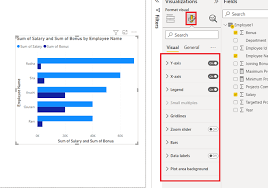
Key Formatting Options:
- Data labels: Turn on to show values
- Sort order: Sort by value (descending)
- Colors: Use consistent, business-friendly colors
- Axis titles: Rename for clarity
- Gridlines: Reduce clutter if necessary
Sorting Example:
- Click the three dots on the visual
- Choose Sort by → Value → Descending
This helps viewers immediately identify top performers.
Using Bar Charts with Filters and Slicers
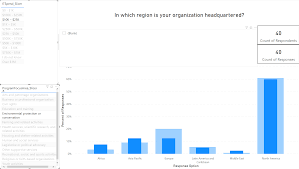
Bar charts become more powerful when combined with slicers.
Example:
- Add a Date slicer
- Filter bar chart by Year or Month
- Add a Region slicer for interactivity
This allows users to explore data dynamically.
Common Mistakes to Avoid
Avoid these common issues when creating bar charts:
- Using too many categories (overcrowding)
- Not sorting the bars
- Mixing unrelated metrics
- Using inconsistent colors
- Ignoring axis labels
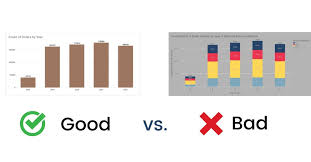
A clean bar chart communicates insights faster and more effectively.
Conclusion
Bar charts are one of the most powerful and beginner-friendly visuals in Power BI. When used correctly, they provide clear comparisons, highlight differences, and support effective decision-making.
By understanding when to use a bar chart, how to structure your data, and how to format the visual professionally, you can create reports that are both insightful and visually appealing.