What Is a Dashboard?
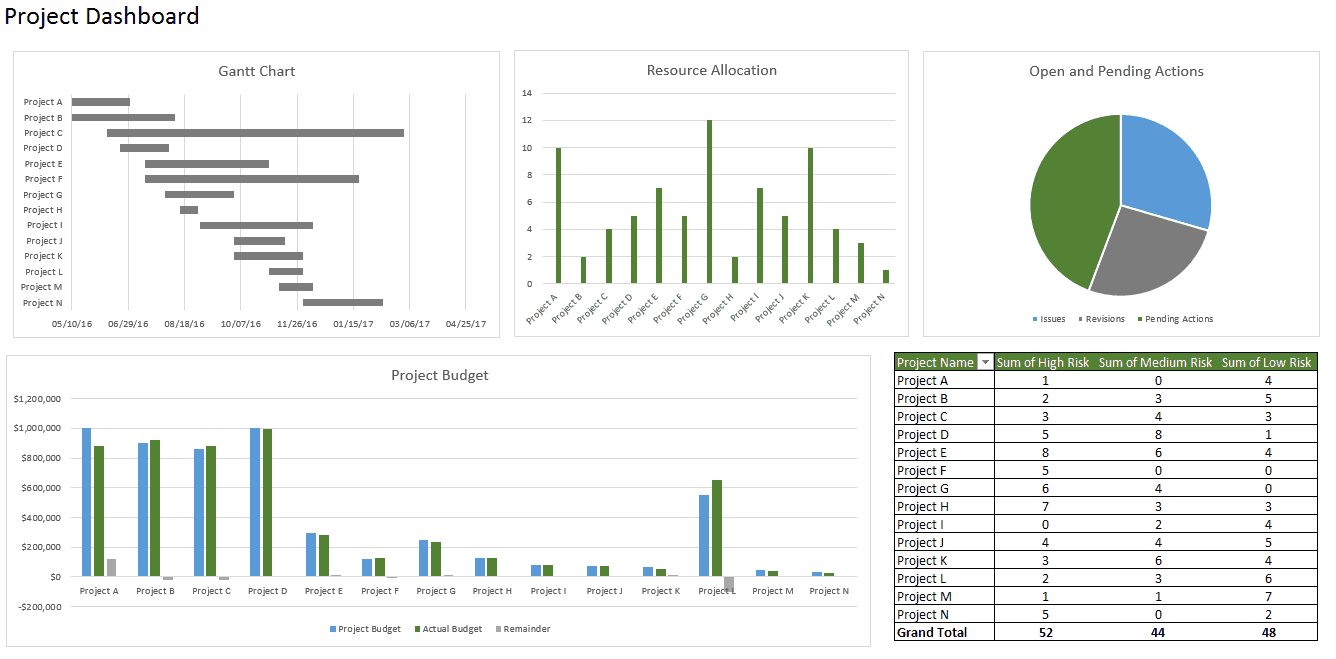
Dashboards track KPIs, metrics, and other data points in one visual, central place. They give you a high-level view of work, helping you make quick decisions and keeping everyone up to date. A dashboard’s visual nature simplifies complex data and provides an at-a-glance view of current status or performance in real time.
Dashboards are made up of tables, charts, gauges, and numbers. They can be used in any industry, for almost any purpose. For example, you could make a project dashboard, financial dashboard, marketing dashboard, and more.
Before Building the Dashboard: Research, Questions, & Things to Consider
Before you start building your dashboard, first take some time to reflect on why you need a dashboard, what purpose it will serve, where the data will come from, and what capabilities you do and don’t need.
It might also be helpful to mock up your Excel dashboard on a piece of paper. Draw boxes for each data type to get a sense of the layout and add quick sketches of the type of graphs you want to include. This mockup will help get everyone on the same page and let you get approval from stakeholders before you start spending time and money on the actual dashboard.
Things to Consider: How to Design the Dashboard
- Dashboard elements: What do you want to include on your dashboard? You can choose from
- static tables, pivot tables, dynamic charts, Excel gauge widgets, or non-charting objects, like auto-shape objects. Do you want to add a lot of small charts or a couple of big charts?
- Identifying the elements, you want to add to your dashboard will help you, group, similar data together and give you an idea of the layout.
- Dashboard background color: How much color do you want to incorporate into your dashboard? Do you want to add a dashboard background color to make the dashboard elements pop? Do you want to color-code similar charts?
- Enhancing the dashboard UI: How important is the ease of use? Do you want to spend time enhancing the dashboard UI? You could add hierarchy to the layout for easy navigation, add drop-down lists, add labels to each graph with auto-shape objects, or use freeze panes to prevent users from scrolling.
How to Bring Data into Excel
Before creating dashboards in Excel, you need to import the data into Excel. You can copy and paste the data, or if you use CommCare, you can create an Excel Connection to your export. But the best way is to use ODBC (or Live Data Connector). ODBC can connect your apps to Excel, passing real-time data from your app to Excel. As data is updated in your app, your Excel dashboard will also be updated to reflect the latest information. This is a perfect option if you track and store data in another place, and prefer creating a dashboard in Excel. Data can be imported in two different ways: in a flat file or a pivot table.
Set Up Your Excel Dashboard File
Once you have added your data, you need to structure your workbook. Open a new Excel Workbook and create two to three sheets (two to three tabs). You could have one sheet for your dashboard and one sheet for the raw data (so you can hide the raw data). This will keep your Excel workbook organized. In this example, we’ll have two tabs

Create a Table with Raw Data
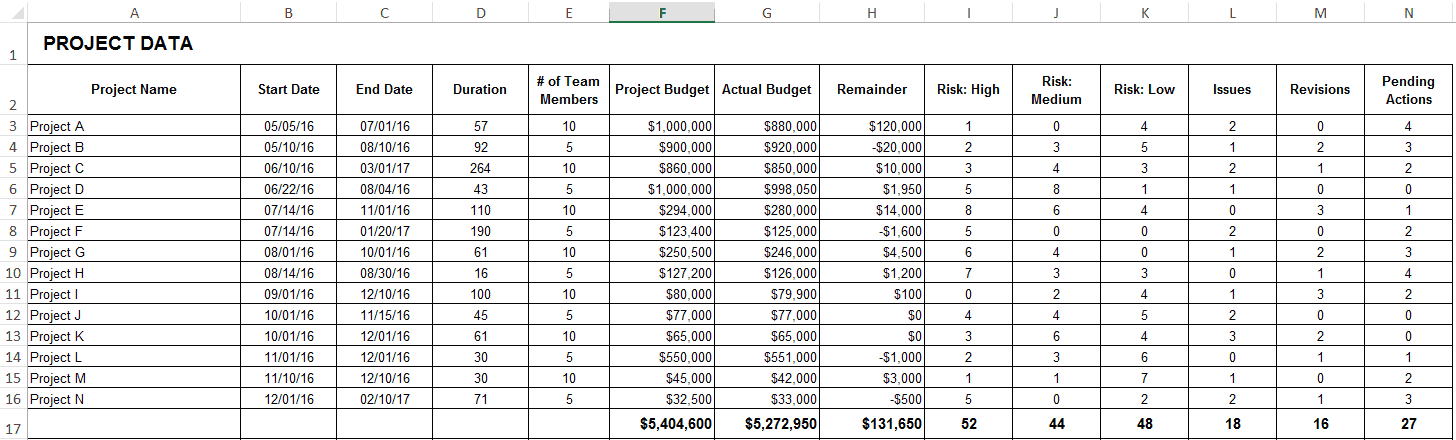
- In the Raw Data sheet, import or copy and paste your data. Make sure the information is in a tabular format. This means that each item or data point lives in one cell.
- In this example, we’re adding columns for Project Name, Timeline, Number of Team Members, Budget, Risks, Open Tasks, and Pending Actions.
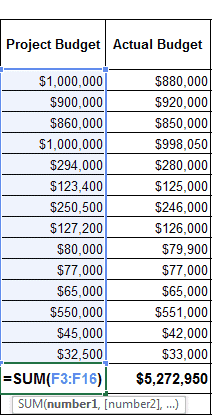
- If needed, you can use a formula to automatically add all the values in a column. We will do this for our Budget, Risks, Open, and Pending Actions columns. Click on an empty cell at the bottom of the column, and type =SUM (After the open parenthesis, click the first cell in the column and drag your mouse down to the last cell. Then, add a close parenthesis to your formula. Repeat as necessary.
Analyze the Data
Before building the dashboard, take some time to look at your data and figure out what you want to highlight. Do you need to display all the information? What kind of story are you trying to communicate? Do you need to add or remove any data?
Once you have an idea of your dashboard’s purpose, think about the different tools you can use. Options include:
- Excel formulas like SUMIF, OFFSET, COUNT, VLOOKUP, GETPIVOTDATA, and others
- Pivot tables
- Excel tables
Build the Dashboard
Add a Gantt Chart
We’ll add a Gantt chart to visually show your project timeline.
- Go to your Dashboard sheet and click Insert.
- In the Charts section, click the bar chart icon and select the second option.
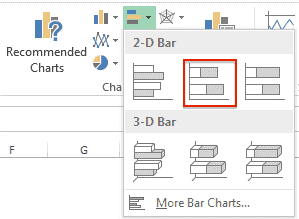
You’ll now have to link this bar chart to the Project Name, Start Date, and Duration columns in your Raw Data sheet.

Create and Format Charts
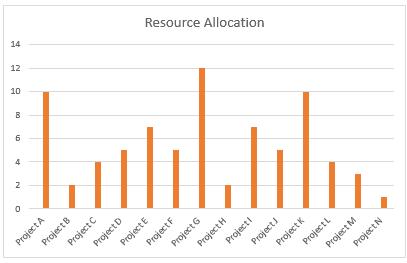
- In your Dashboard sheet, click Insert and select the kind of chart you’d like to make. For this first example, we’ll create a column chart.
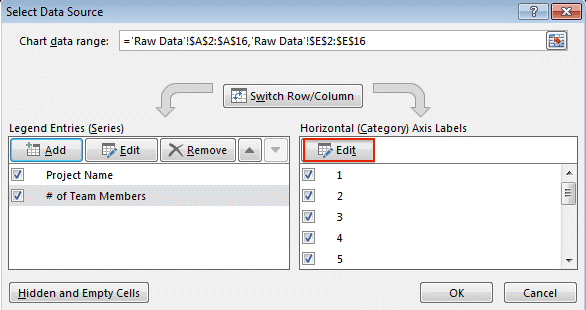
- Right-click on the chart and click Select Data.
- Click Add in Legend Entries (Series).
- In the Series name field, click the title of the column you want to add to the Raw Data sheet. Hit enter.
- In the Series values field, select all the data in that corresponding column. Hit enter and then click Ok.
- You’ll notice that your X-axis is not correctly labeled. To fix this, click Edit in the Horizontal (Category) Axis Labels, and in the Raw Data Sheet, select what you’d like to display on the X-axis.
- To add a title to your chart, select your chart and click the Design tab.
- Click Add Chart Element > Chart Title > Above Chart.
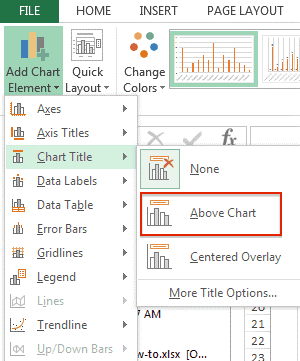
Type your title in the text field on the chart.
Repeat this process for any other charts you want to create.
Insert PivotTables
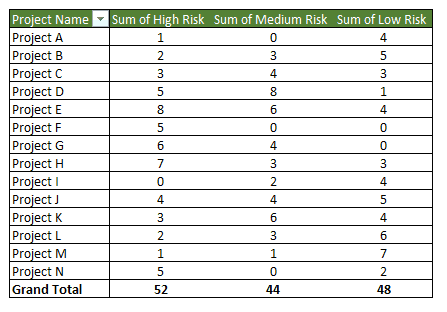
A pivot table allows you to extract and highlight the most important information from a large data set.
Here’s how to insert a pivot table:
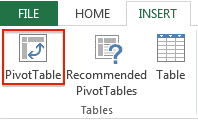
- Go to your Dashboard sheet and on the Insert tab, click the PivotTable button.
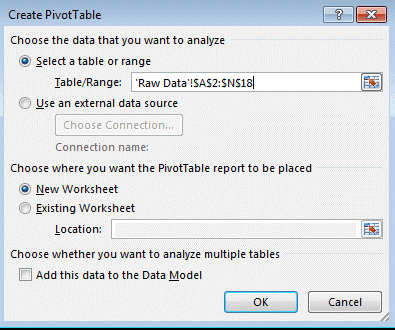
A pop-up box will appear. In the Table/Range field, click the icon at the end and select your whole data table from your Raw Data sheet. Click Ok.
The PivotTable Field List will appear on the right side of your screen. Select which subsets of data you would like to include in your pivot table by clicking the boxes.
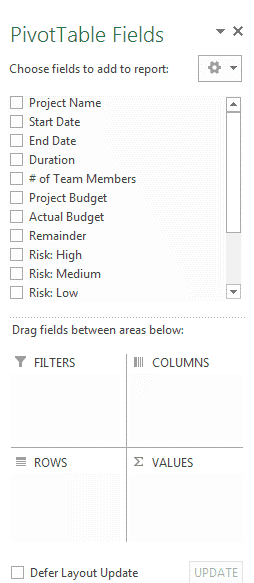
If you’d like to include another pivot table in your dashboard, repeat steps 1-3.