
KPI (Key Performance Indicator) visuals are designed to show performance at a glance. They help decision-makers quickly understand whether a metric is improving, declining, or meeting its target. KPI visuals are widely used in executive dashboards, performance reports, and monitoring systems.
This article explains how to create a KPI visual in Power BI, how it works, and best practices for using it effectively.
What Is a KPI Visual in Power BI?
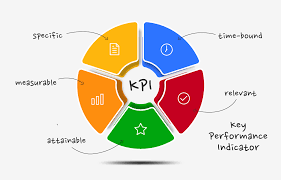
A KPI visual displays:
- A current value (indicator)
- A target value
- A trend over time
It answers one main question:
“Are we meeting our goal?”
In Power BI, a KPI visual typically includes:
- An indicator (actual value)
- A goal (target)
- A trend axis (usually a date)
When to Use a KPI Visual
Use KPI visuals when you want to:
- Monitor performance against targets
- Track progress over time
- Highlight success or underperformance
- Present summary metrics to executives
Common Use Cases:
- Monthly revenue vs target
- Sales growth tracking
- Customer acquisition performance
- Operational efficiency metrics
KPI visuals are best for summary insights, not detailed analysis.

Preparing Your Data for a KPI Visual
Your data should include:
| Date | Actual Value | Target |
|---|---|---|
| Jan | 50000 | 60000 |
| Feb | 58000 | 60000 |
You will typically need:
- A numeric measure (actual value)
- A target value (fixed or calculated)
- A date field for trend analysis
Creating measures using DAX is recommended.
Step-by-Step: How to Create a KPI Visual in Power BI
Step 1: Create Measures
Example measures:
Total Sales = SUM(Sales[Amount])
Sales Target = 60000
Step 2: Select the KPI Visual
- Go to Report View
- Select KPI from the Visualizations pane
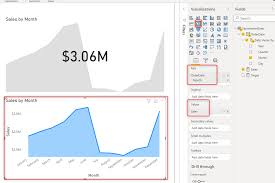
Step 3: Assign Fields
- Drag Total Sales → Indicator
- Drag Sales Target → Target goals
- Drag Date → Trend axis
Power BI will automatically evaluate performance.
Understanding KPI Status Colors
Power BI automatically applies colors:
- Green → Target met or exceeded
- Red → Below target
- Yellow → Warning or borderline
You can customize thresholds in the formatting pane.
Example:
- ≥ 100% → Green
- 80–99% → Yellow
- < 80% → Red
This visual language makes insights instantly clear.
Formatting KPI Visuals for Professional Dashboards
Key formatting options include:
- Indicator units (K, M, B)
- Trend line visibility
- Font size and style
- Display labels
- Background and borders
Keep KPI visuals clean and minimal.
KPI Visual vs Card Visual
| Feature | KPI Visual | Card Visual |
|---|---|---|
| Shows target | Yes | No |
| Shows trend | Yes | No |
| Displays status | Yes | No |
| Simplicity | Medium | High |
Use KPI visuals for performance tracking and Cards for single values.
Common Mistakes to Avoid
Avoid:
- Using KPIs without targets
- Missing date fields for trend
- Overcrowding KPIs
- Using KPIs for non-performance metrics
KPIs should answer one clear business question.
Conclusion
KPI visuals are powerful tools for tracking performance and communicating results quickly. When built correctly, they give stakeholders instant clarity on whether goals are being achieved.
Mastering KPI visuals helps you design executive-level dashboards that drive action and accountability.