

Line charts are one of the most effective visuals for showing trends over time. They help users understand how values change, identify growth or decline patterns, and compare performance across different periods.
This article explains how to create a Line Chart in Power BI, when to use it, how to configure it properly, and best practices for building clean, professional reports.
What Is a Line Chart in Power BI?
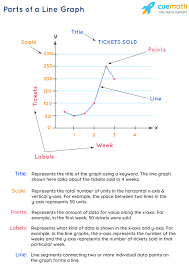
A line chart displays data points connected by lines, making it easy to visualize movement over time.
In Power BI:
- The X-axis usually contains time-based fields (Date, Month, Year)
- The Y-axis contains numeric values
- Multiple lines can represent different categories
Line charts are ideal for identifying:
- Trends
- Patterns
- Seasonality
- Growth or decline
When to Use a Line Chart
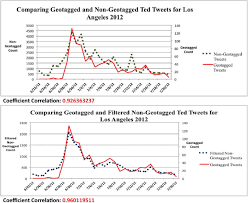
Use line charts when you want to:
- Track changes over time
- Compare trends between categories
- Identify peaks and dips
- Analyze performance progression
Common Use Cases:
- Monthly sales trends
- Revenue growth over years
- Website traffic over time
- KPI performance tracking
Line charts are not ideal for one-time comparisons — use bar or column charts instead.
Preparing Your Data for a Line Chart
Your data should include:
| Date | Value |
|---|---|
| Jan | 120 |
| Feb | 150 |
| Mar | 140 |
For multiple lines:
| Date | Category | Value |
|---|---|---|
| Jan | Product A | 120 |
| Jan | Product B | 90 |
Ensure:
- Date fields are properly recognized as Date types
- Values are numeric
- Missing dates are handled correctly
Step-by-Step: How to Create a Line Chart in Power BI
Step 1: Load Your Data
- Open Power BI Desktop
- Click Get Data
- Load your dataset
Step 2: Select the Line Chart Visual
- Go to Report View
- In the Visualizations pane, select Line Chart
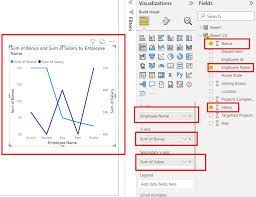
Step 3: Assign Fields
- Drag Date field → X-Axis
- Drag Numeric value → Y-Axis
- (Optional) Drag Category → Legend
Power BI automatically plots the line.
Formatting a Line Chart for Better Insights
Formatting improves clarity and storytelling.
Key Formatting Options:
- Turn on Data markers
- Adjust line thickness
- Use distinct colors for multiple lines
- Customize axis titles
- Enable gridlines sparingly
Tip:
Use smooth lines only when appropriate — avoid hiding actual data points.
Using Multiple Lines for Comparison
To compare trends:
- Add a category to the Legend
- Each category becomes a separate line
Example:
- Sales for Product A vs Product B
- Revenue by region over time
Ensure colors contrast well and legends are clearly labeled.
Adding Analytics to Line Charts
Power BI allows advanced analytics:
- Trend lines
- Forecasting
- Constant lines
- Min/max lines
How to Add:
- Select the line chart
- Open the Analytics pane
- Add desired elements
This enhances interpretation and decision-making.
Using Line Charts with Filters and Slicers
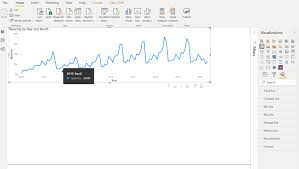
Line charts become more powerful with interactivity:
- Date slicers
- Category filters
- Cross-highlighting with other visuals
This allows users to explore trends dynamically.
Common Mistakes to Avoid
Avoid:
- Using line charts without time-based data
- Overcrowding with too many lines
- Ignoring missing date values
- Using inconsistent time intervals
If trends are unclear, simplify the chart.
Conclusion
Line charts are essential for analyzing trends and changes over time in Power BI. When designed correctly, they reveal patterns, support forecasting, and communicate performance clearly.
Mastering line charts will significantly enhance your ability to build insightful and professional Power BI reports.