
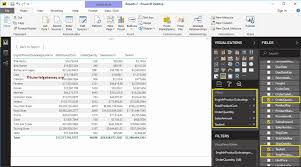
While charts are excellent for visual storytelling, tables are essential when users need to see exact values, detailed records, and multiple fields at once. Table visuals allow you to present structured data clearly and accurately, making them indispensable for operational and analytical reporting.
This article explains how to create a Table visual in Power BI, when to use it, how to format it professionally, and best practices for clarity and performance.
What Is a Table Visual in Power BI?
A Table visual displays data in rows and columns, similar to Excel, but with full Power BI interactivity.
In a Power BI table:
- Each row represents a record
- Each column represents a field or measure
- Data updates dynamically with filters and slicers
Tables are ideal for displaying precise information where accuracy matters.
When to Use a Table Visual
Use a table visual when you want to:
- Display detailed records
- Show exact numeric values
- Compare multiple fields simultaneously
- Support audits and data validation
- Complement charts with raw data
Common Use Cases:
- Sales transaction lists
- Customer records
- Product inventories
- Financial statements
If the goal is exploration rather than summary, tables are the best choice.
Preparing Your Data for a Table Visual
Your dataset should be clean and well-structured.
Ensure:
- Column names are clear and descriptive
- Data types are correctly assigned
- Measures are created for calculations
- Unnecessary columns are removed
Example fields:
- Order ID
- Customer Name
- Product
- Quantity
- Sales Amount
- Order Date
Step-by-Step: How to Create a Table Visual in Power BI
Step 1: Load Your Data
- Open Power BI Desktop
- Click Get Data
- Load your dataset
Step 2: Select the Table Visual
- Go to Report View
- In the Visualizations pane, select Table
Step 3: Add Fields
- Drag the required fields into the Values well
- Arrange columns in your preferred order
The table will automatically populate with data.
Formatting a Table Visual for Readability
Formatting improves clarity and user experience.
Key Formatting Options:
- Adjust column width
- Enable or disable gridlines
- Apply thousand separators
- Control decimal places
- Change header and value fonts
Tips:
- Align numeric columns to the right
- Freeze important columns
- Avoid excessive colors
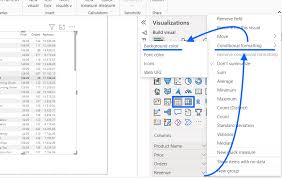
Sorting and Filtering in Table Visuals
Tables support powerful sorting and filtering.
Sorting:
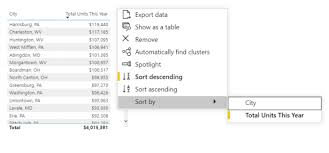
- Click column headers to sort ascending or descending
Filtering:
- Use visual-level filters
- Add slicers for dynamic filtering
This makes tables interactive and user-friendly.
Using Conditional Formatting in Tables
Conditional formatting highlights important values.
Examples:
- Color sales above target in green
- Highlight negative values in red
- Use data bars for quick comparison
How to Apply:
- Click the dropdown next to a column
- Select Conditional formatting
This enhances insight without clutter.
Table Visual vs Matrix Visual
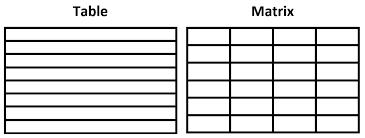
| Feature | Table | Matrix |
|---|---|---|
| Flat structure | Yes | No |
| Grouping | No | Yes |
| Hierarchies | No | Yes |
| Totals & subtotals | Limited | Advanced |
Use tables for detailed records and matrices for grouped summaries.
Common Mistakes to Avoid
Avoid:
- Overloading tables with too many columns
- Using tables where charts would be clearer
- Ignoring formatting consistency
- Displaying unfiltered large datasets
Tables should be clean, readable, and purposeful.
Conclusion
Table visuals are essential for presenting detailed and precise data in Power BI. When designed correctly, they provide clarity, accuracy, and flexibility that charts alone cannot offer.
Mastering table visuals allows you to build reports that balance visual insight with data accuracy, making your dashboards more complete and professional.