
When working with data in Microsoft Excel, raw numbers and plain text can often look messy and difficult to understand. This is where formatting becomes essential. Formatting helps organize your data, improve readability, and make your spreadsheets look more professional.
Good formatting can transform a basic spreadsheet into a clear and visually appealing report that is easier to interpret and analyze.
What is Formatting in Excel?
Formatting refers to the process of changing the appearance of data in a worksheet without altering the actual data itself.
With formatting, you can modify:
- Font styles
- Cell colors
- Number formats
- Alignment
- Borders
- Conditional formatting
These tools help make your spreadsheet more organized and easier to read.

Changing Font Styles
Excel allows you to customize how text appears inside cells.
You can change:
- Font type (e.g., Calibri, Arial, Times New Roman)
- Font size
- Font color
- Bold, Italic, and Underline
How to Change Font Style
- Select the cells you want to format.
- Go to the Home tab.
- Use the Font section to apply your preferred style.
Formatting fonts can help highlight headings and important data.

Applying Number Formatting
Number formatting changes how numbers are displayed in Excel.
Examples include:
- Currency
- Percentage
- Date
- Time
- Accounting format
For example, the number 5000 can be displayed as:
- $5,000
- 5,000.00
- 5000% (if formatted as percentage)
Steps to Apply Number Formatting
- Select the cells containing numbers.
- Go to the Home tab.
- Use the Number group to choose a format.

Adjusting Cell Alignment
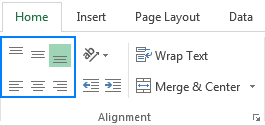
Alignment controls how content is positioned within a cell.
Excel allows you to align text:
- Left
- Center
- Right
- Top
- Middle
- Bottom
You can also enable Wrap Text, which allows long text to appear on multiple lines within the same cell.
Steps to Adjust Alignment
- Select the cells you want to align.
- Go to the Home tab.
- Use the Alignment group to adjust positioning.
Using Borders and Cell Colors
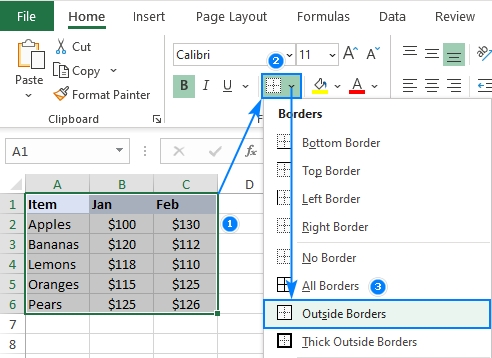
Borders and colors help separate data and improve visual structure.
Excel allows users to:
- Add borders around cells
- Apply background colors
- Highlight important rows or columns
Steps to Apply Borders
- Select the cells.
- Go to the Home tab.
- Click the Borders dropdown menu.
- Choose a border style.
Using Conditional Formatting
Conditional formatting automatically changes the appearance of cells based on specific rules.
For example, you can:
- Highlight the highest sales values
- Color negative numbers in red
- Identify duplicate entries
- Show data bars for comparison
How to Apply Conditional Formatting
- Select the data range.
- Go to the Home tab.
- Click Conditional Formatting.
- Choose the desired rule.

Tips for Professional Spreadsheet Formatting
To create professional-looking spreadsheets:
- Use bold fonts for headings
- Maintain consistent font styles
- Avoid excessive colors
- Use borders to separate sections
- Align numbers properly for readability
Simple and clean formatting improves the clarity of your data.
Common Formatting Mistakes
Some common formatting mistakes include:
- Using too many colors
- Overusing bold or italic text
- Inconsistent font styles
- Misaligned numbers
Good formatting should enhance readability, not make the spreadsheet look cluttered.
Conclusion
Formatting is an essential skill for anyone using Microsoft Excel. It allows users to transform plain data into organized, professional-looking spreadsheets that are easier to read and analyze.
By mastering Excel formatting tools such as fonts, number formats, alignment, borders, and conditional formatting, you can significantly improve the quality and presentation of your spreadsheets.