
With the explosion of data being generated every day, businesses are increasingly turning to analytics tools to make sense of this vast amount of information and derive valuable insights from it for strategic decision-making processes.
BI tools play a crucial role in this process by allowing companies to visualize and analyze complex data sets, identify trends and patterns, and make informed decisions based on actionable insight.
What is Excel?

Excel is a powerful spreadsheet program developed by Microsoft that allows users to organize, analyze, and visualize data in a user-friendly format. It is widely used for various tasks such as creating budgets, tracking expenditures, managing stock, etc by businesses, and students.
What is Power BI?

Power BI is a powerful business intelligence tool developed by Microsoft that allows users to visualize and analyze their data and create reports in a user-friendly and interactive way.
Power BI Vs Excel: Key Differences
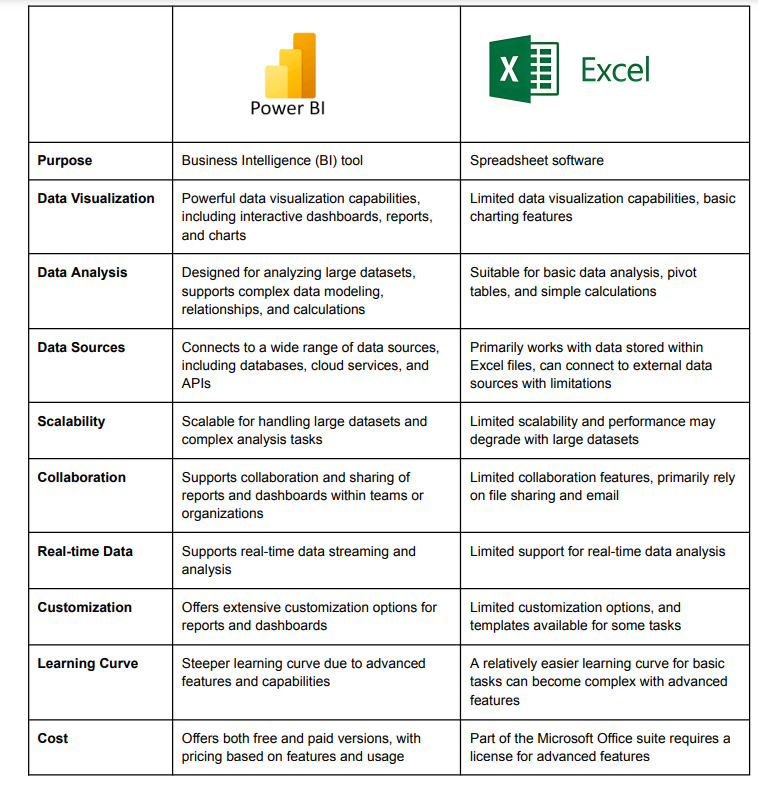
1. Power BI vs Excel: Data connectivity
Data connectivity is crucial to any data analysis tool, as it allows users to connect and retrieve data from various data sources.
Excel:
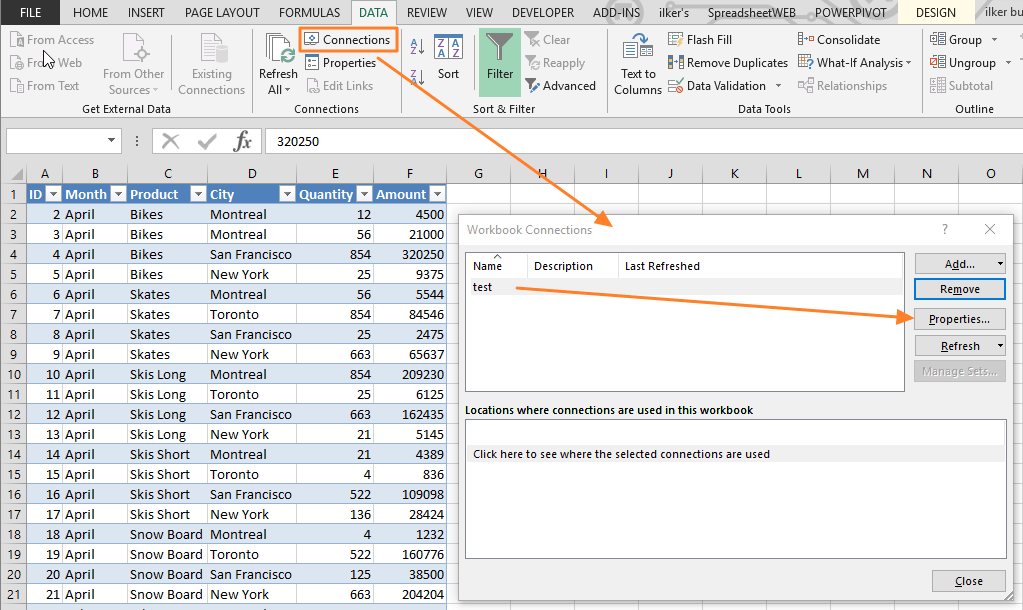
Excel offers basic data connectivity features that allow users to import data from various sources such as database, CSV files, and web services. Users can also use Excel’s built-in functions and formulas to manipulate and analyze the imported data to perform calculations.
Power BI
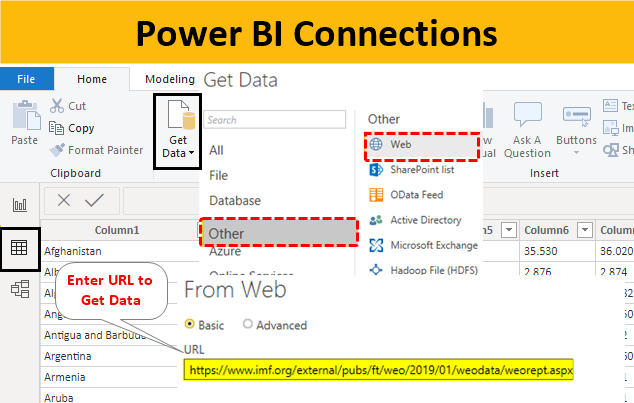
Power BI is a business tool specifically designed for exploring and visualizing large amounts of data. Power BI offers more advanced data connectivity capabilities than Excel, allowing users to connect to a wider range of sources including cloud services like Azure SQL Database, Google Analytics, Salesforce, and more.
Power BI also provides features such as Dataflows and DirectQuery that enable real-time access to data without importing it into the tool.
2. Power BI vs Excel: User interface
Excel
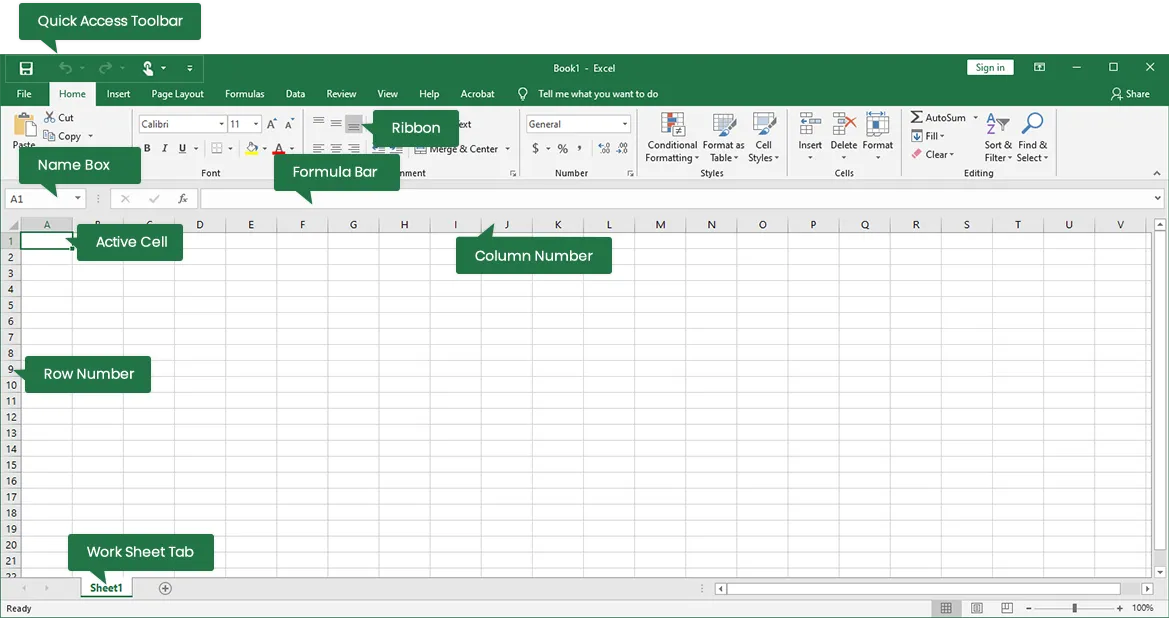
Excel is a familiar tool for many people, as it is widely used in businesses for various tasks such as creating spreadsheets, charts, and graphs. The user interface of Excel is relatively intuitive, with menus and functions that are easy to navigate.
Power BI
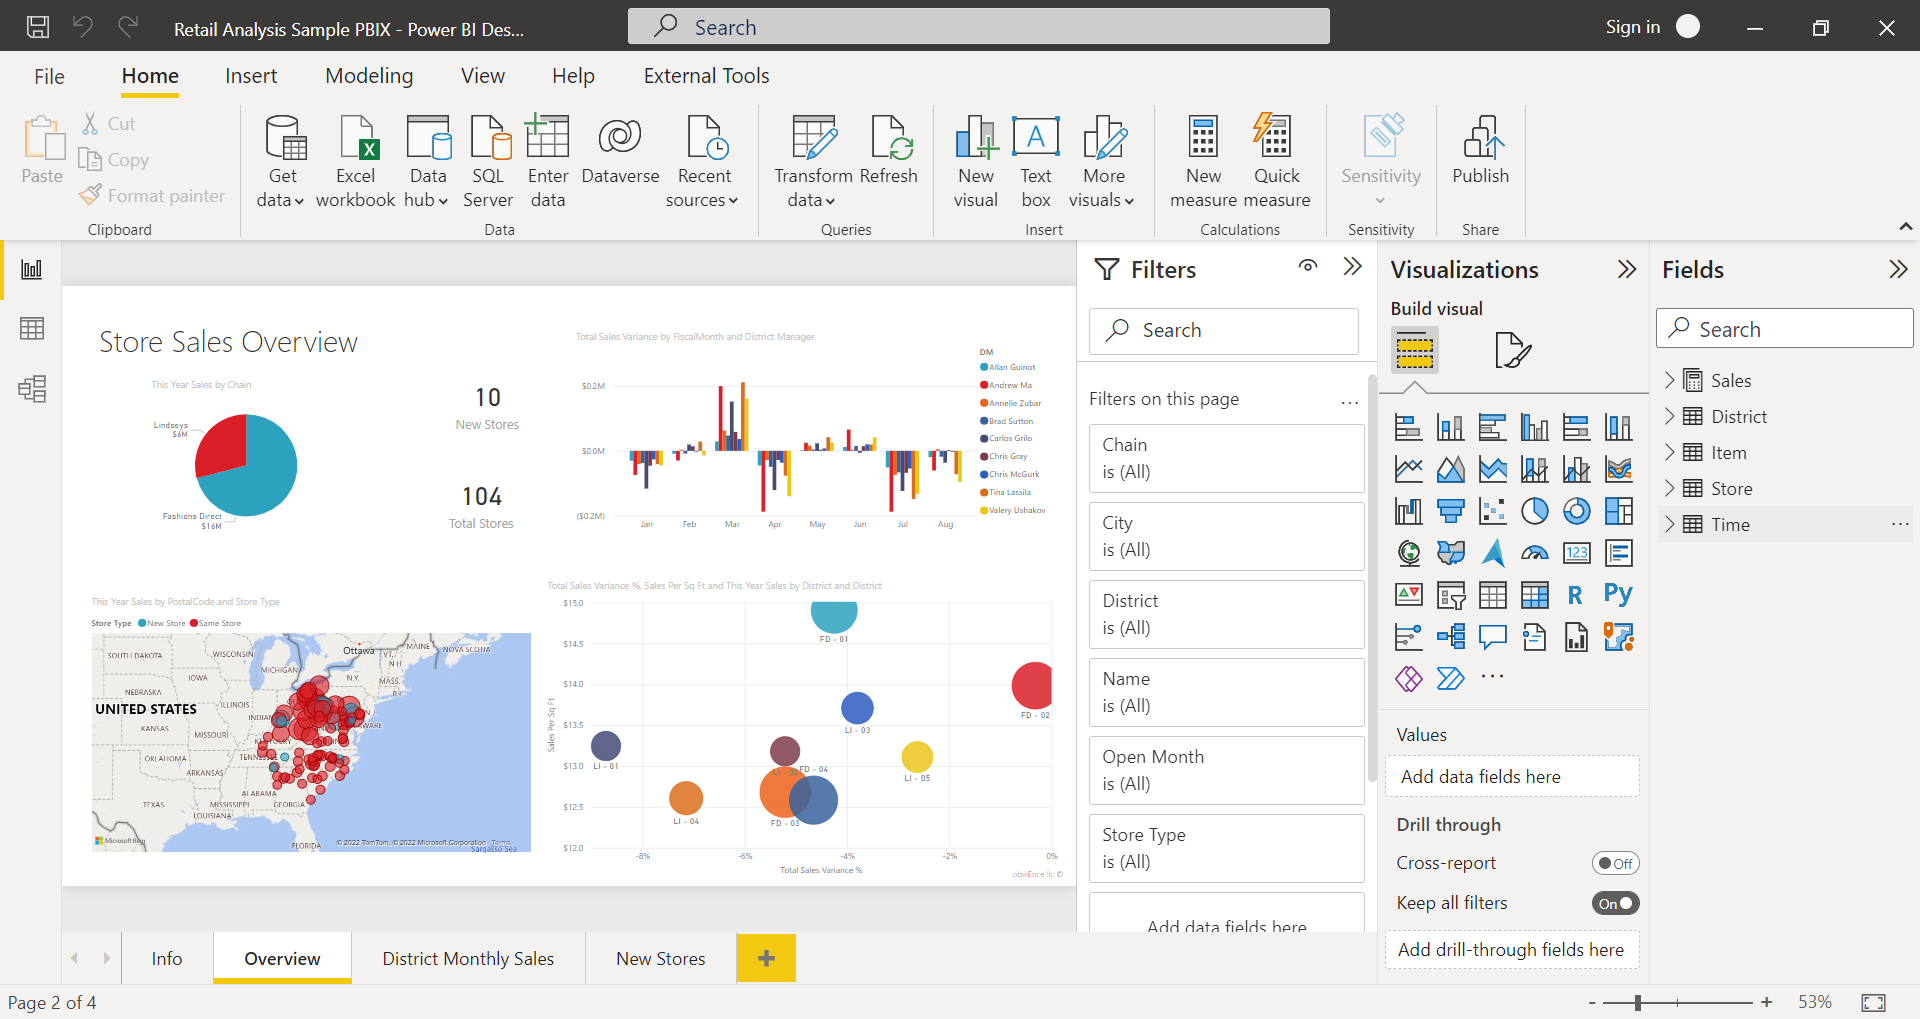
Power BI has a more modern and streamlined user interface that is specifically designed for data analysis and visualization. The drag-and-drop interface in Power BI allows users to create dynamic dashboards and reports quickly and easily.
3. Power BI vs Excel: Data Visualization Options
Data Visualization is an essential aspect of analyzing and interpreting data in today’s digital age.
Excel
Excel offers a variety of chart types, including bar graphs, line charts, pie charts, and more. Users can easily create these charts by selecting their data and inserting a chart from the toolbar.
Excel also has various customization options such as colors, labels, axes, and other visual elements.
Power BI
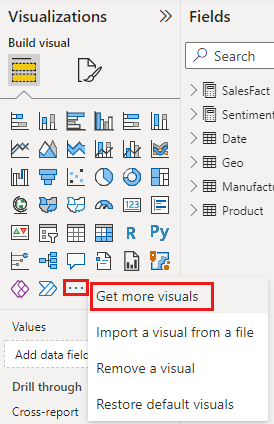
Power BI offers a robust set of features compared to Excel, allowing users to create interactive dashboards and reports with drill-down capabilities. If you need advanced analytics features such as real-time reporting, predictive modeling, or integration with multiple data sources, then Power BI would be the better choice.
Conclusion
The debate between power BI and Excel ultimately comes down to your requirements and use cases. Excel is a versatile tool that many of us are already familiar with, Power BI offers advanced data visualization and analysis capabilities that can take your reporting to the next level.