
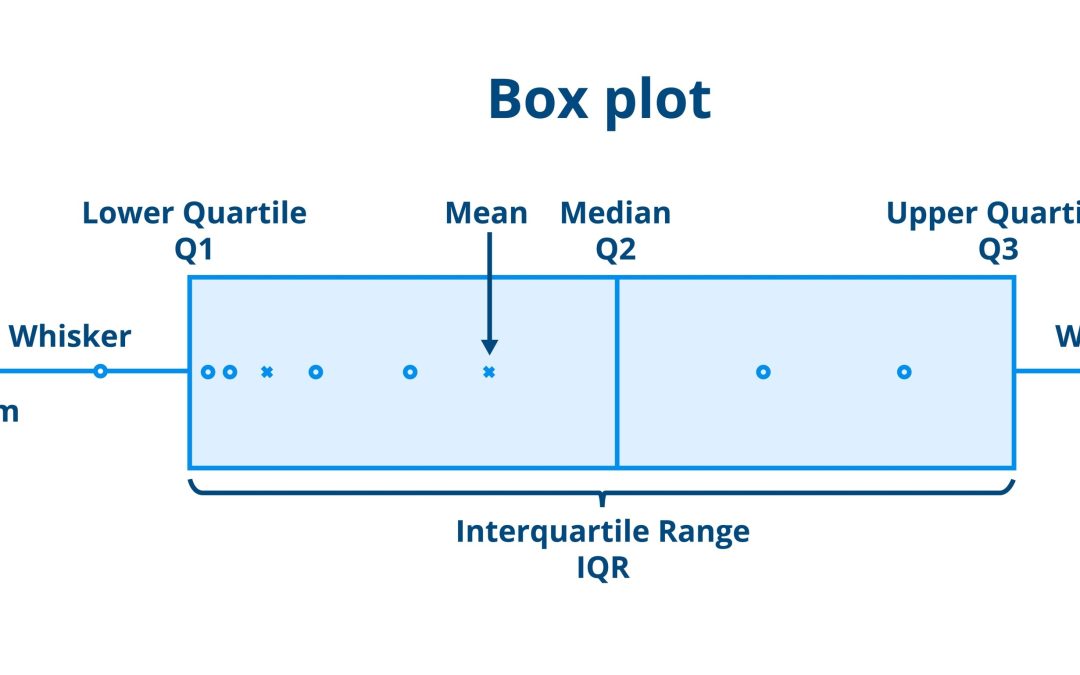
In the world of data science, outliers are like uninvited guests at a party—sometimes they provide surprising insights, but usually, they just mess up the vibe. An outlier is a data point that deviates significantly from the rest of the observations, potentially skewing your averages and ruining the accuracy of your machine learning models.
This guide explores how to identify these anomalies and handle them using Python’s robust ecosystem.
Why Outlier Detection Matters
Ignoring bad data is a recipe for disaster. Whether you are analyzing financial transactions or sensor readings, outliers can:
- Distort Statistical Summaries: A single extreme value can make a “normal” average look misleadingly high or low.
- Impact Model Performance: Many algorithms, like Linear Regression, are sensitive to outliers, leading to poor predictions.
- Signal Fraud or Errors: Outliers aren’t always “bad”; sometimes they represent a credit card theft or a broken hardware sensor that needs immediate attention.
Identifying Outliers with Statistical Methods
Before you can handle outliers, you need to find them. Python makes this easy with two primary statistical approaches.
1. The Z-Score Method
The Z-score represents how many standard deviations a data point is from the mean. Typically, any point with a Z-score greater than 3 or less than -3 is considered an outlier.
Python
import numpy as np
from scipy import stats

data = [10, 12, 12, 13, 12, 11, 100, 13, 12, 11] # 100 is clearly an outlier
z_scores = np.abs(stats.zscore(data))
filtered_entries = np.where(z_scores > 2) # Threshold of 2 for small datasets
print(f"Outlier indices: {filtered_entries}")
2. The Interquartile Range (IQR) Rule
The IQR method is more robust than the Z-score because it isn’t influenced by the outliers themselves. It focuses on the “middle 50%” of the data.

Python
import pandas as pd

df = pd.DataFrame({'values': [10, 12, 12, 13, 12, 11, 100, 13, 12, 11]})
Q1 = df['values'].quantile(0.25)
Q3 = df['values'].quantile(0.75)
IQR = Q3 - Q1

lower_bound = Q1 - 1.5 * IQR
upper_bound = Q3 + 1.5 * IQR

outliers = df[(df['values'] < lower_bound) | (df['values'] > upper_bound)]
print(outliers)
Advanced Detection: Isolation Forest
For complex, multi-dimensional datasets, simple statistics often fail. Isolation Forest is a machine learning algorithm specifically designed for anomaly detection. It works by “isolating” observations; because outliers are few and different, they are easier to isolate than normal points.
Python
from sklearn.ensemble import IsolationForest

model = IsolationForest(contamination=0.1) # Expecting 10% outliers
model.fit(df[['values']])
df['anomaly'] = model.predict(df[['values']]) # -1 indicates an outlier
Strategies for Handling Outliers
Once you’ve flagged the “bad” data, you have three main paths forward:
1. Removal (Trimming)
If you are certain the outlier is a data entry error or a technical glitch, you can simply drop the row.
- Pros: Clean data for modeling.
- Cons: You lose information and reduce your sample size.
2. Transformation
Applying a mathematical transformation can dampen the effect of extreme values. Log transformations are a favorite for skewed financial data.
Python
# Applying log transformation
df['log_values'] = np.log(df['values'])
3. Capping (Winsorization)
Instead of deleting the data, you “cap” it at a certain percentile (e.g., the 95th percentile). This retains the record but limits its disruptive influence.
Common Pitfalls to Avoid
Identifying outliers is as much an art as it is a science. Keep these things in mind:
- The “Natural” Outlier: In some datasets (like wealth distribution), outliers are a real and important part of the story. Don’t delete them just because they look weird.
- Context is King: A temperature of 40°C is an outlier in London in January, but perfectly normal in Dubai in July. Always consider the context of your data collection.
- Data Leakage: If you are building a predictive model, calculate your outlier thresholds only on the training data, then apply them to the test data.
Conclusion
Mastering outlier detection in Python allows you to move beyond “messy” data and build models based on reality. Whether you use the simple IQR method or the sophisticated Isolation Forest, the goal remains the same: ensuring your insights are driven by meaningful patterns, not mathematical noise. By effectively identifying and handling bad data, you turn your raw datasets into high-quality assets.