
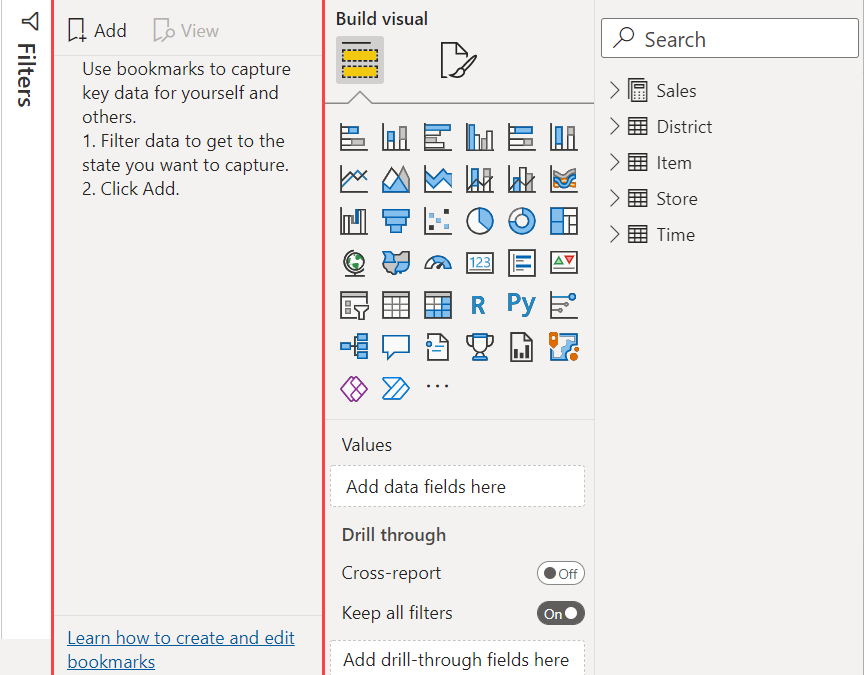
Modern dashboards are no longer just about displaying charts — they are about user experience. Users expect to interact with reports, switch between views, and explore insights without confusion.
In Power BI, one of the most powerful ways to achieve this is through Bookmarks and Buttons. These features allow you to create dashboards that behave like applications — with navigation, toggles, and dynamic views — all without writing a single line of code.
In this article, you will learn how to use bookmarks and buttons to build interactive, professional dashboards.
What Are Bookmarks in Power BI?
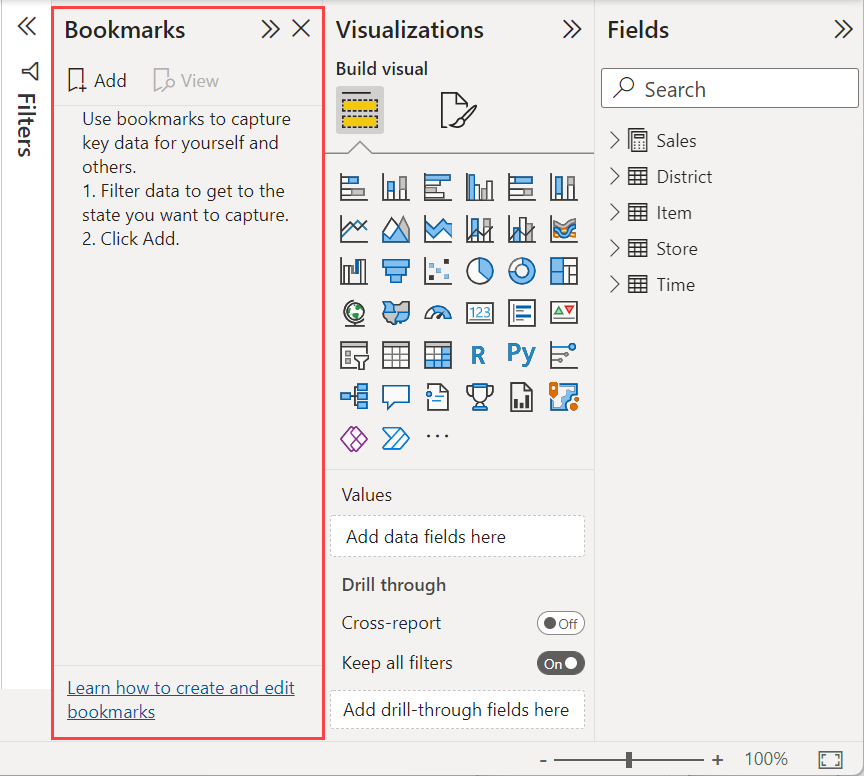
A bookmark captures the current state of a report page. This includes:
- Filters applied
- Slicer selections
- Visibility of visuals
- Sorting and drill states
What bookmarks are used for
- Switching between different views of the same data
- Creating storytelling dashboards
- Showing and hiding visuals
- Resetting reports to default state
Think of a bookmark as a “snapshot” of your report at a particular moment.
Understanding Buttons in Power BI
Buttons are interactive elements that trigger actions when clicked.
What buttons are used for
- Navigating between pages
- Activating bookmarks
- Resetting filters
- Creating menu systems
Buttons turn a static dashboard into an interactive experience.
How to Create a Bookmark (Step-by-Step)
Let’s say you want to create two views:
- Sales Overview
- Profit Analysis
Steps:
- Set up your first view (e.g., Sales visuals visible)
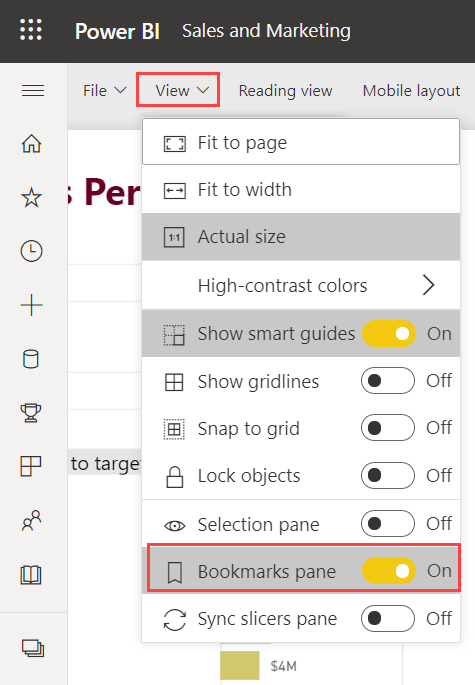
- Open View → Bookmarks Pane
- Click Add
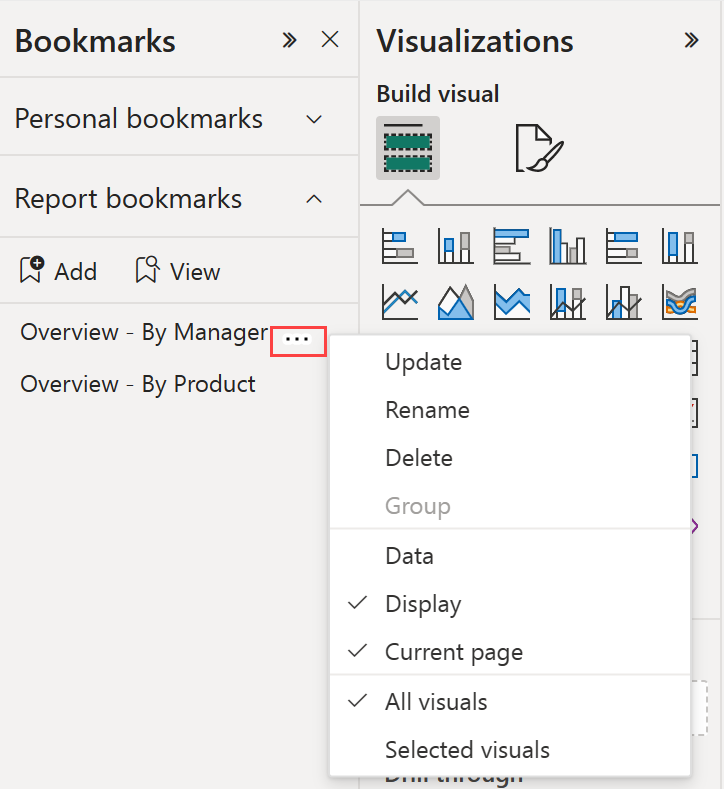
- Rename it to “Sales View”
- Adjust visuals for second view
- Click Add again and rename “Profit View”
Now you have two saved states.
How to Use Buttons with Bookmarks
To make your dashboard interactive:
- Go to Insert → Buttons
- Choose a button type (Blank, Left Arrow, etc.)
- Turn on Action
- Set Type → Bookmark
- Select your bookmark
Now when users click the button, the report changes instantly.
Creating Toggle Effects (Show/Hide Visuals)
One of the most powerful uses of bookmarks is toggling visuals.
Example:
- Show filters panel
- Hide filters panel
How:
- Open Selection Pane
- Hide or show visuals
- Save each state as a bookmark
This creates a clean, professional UI.
Creating Tabbed Dashboards
Instead of multiple pages, you can create tabs:
- Overview
- Details
- Trends
Each tab is controlled by bookmarks and buttons.
This keeps everything in one place while maintaining clarity.
Reset Button (Very Important)
A reset button restores the dashboard to its original state.
Steps:
- Create a bookmark with default filters
- Assign it to a button labeled “Reset”
This improves user experience significantly.
Best Practices
- Use clear button labels (e.g., “View Profit”)
- Keep navigation simple
- Avoid too many bookmarks
- Group visuals logically
- Test all interactions
Common Mistakes to Avoid
- Forgetting to update bookmarks after changes
- Overcomplicating navigation
- Not naming bookmarks properly
- Using too many interactive elements
Simplicity always wins.
Real-World Use Cases
Bookmarks and buttons are widely used in:
- Executive dashboards
- Sales performance reports
- Financial reporting
- HR analytics dashboards
They help transform reports into decision-making tools.
Conclusion
Bookmarks and buttons are one of the most powerful features in Power BI. They allow you to build dashboards that are not just informative, but interactive and intuitive.
By mastering these tools, you can create dashboards that feel like real applications — engaging, dynamic, and easy to use.