
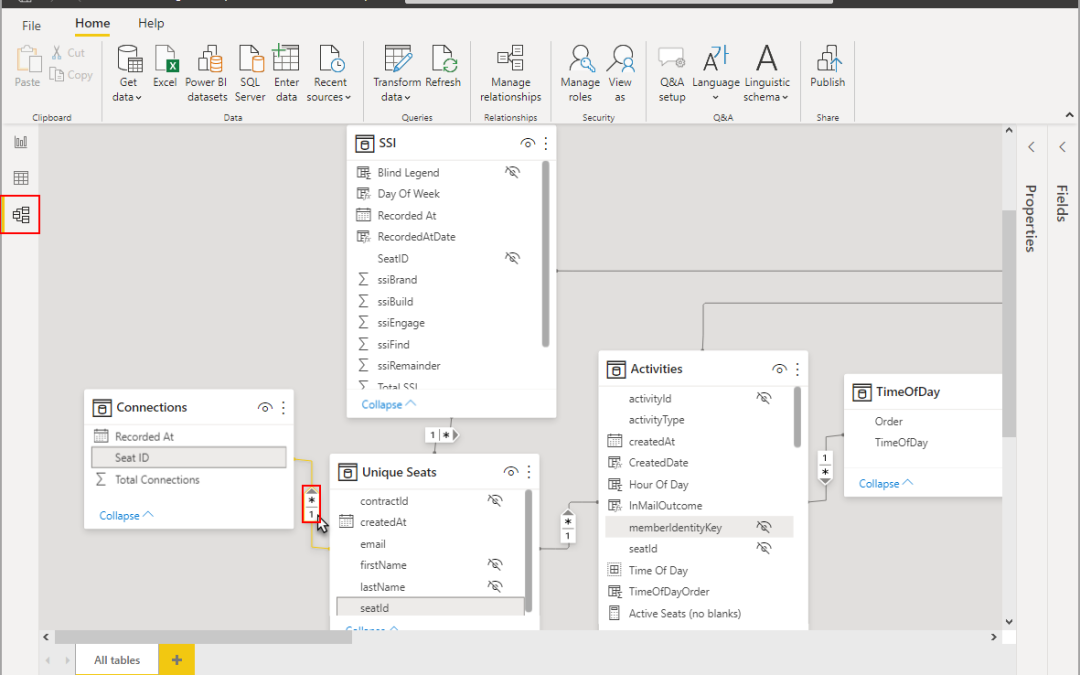
A beautiful dashboard is only as good as the data model behind it. In Power BI, data modeling is what connects your tables, controls how calculations behave, and ensures your visuals return accurate insights.
Many beginners focus only on charts and DAX, but experienced analysts know that a strong data model is the true backbone of every smart dashboard.
In this article, you’ll learn how to build effective table relationships in Power BI, avoid common modeling mistakes, and create dashboards that scale professionally.
What is Data Modeling in Power BI?
Data modeling is the process of connecting multiple tables using relationships so Power BI can analyze them together.
What it is used for
- Combining sales and product tables
- Linking customer and order data
- Enabling DAX calculations
- Creating accurate filters across visuals
Without proper relationships, slicers, charts, and KPIs may produce incorrect results.

Why Relationships Matter
Relationships allow Power BI to understand how data in one table connects to another.
Example
You may have:
- Sales Table → OrderID, ProductID, Amount
- Products Table → ProductID, ProductName
- Customers Table → CustomerID, Region
By linking matching keys, Power BI can analyze sales by product or customer region.
This makes your dashboards smarter and more dynamic.
Understanding the Main Relationship Types
Power BI mainly uses these relationship types:
- One-to-Many (1:*)
- Many-to-One (*:1)
- One-to-One (1:1)
The most common is One-to-Many.
Example
- One Product → Many Sales Records
This is the ideal structure for most business reports.
Step 1: Identify Primary and Foreign Keys
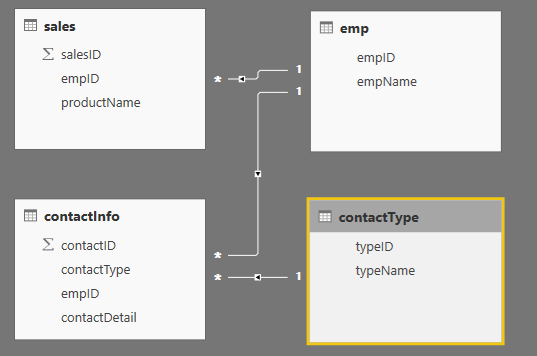
Before creating relationships, identify matching columns.
Common examples
- ProductID
- CustomerID
- OrderID
- Date
What this is used for
These fields act as the bridge between tables.
Example:
- Product table → ProductID
- Sales table → ProductID
The Product table usually contains unique values, while the Sales table contains repeated values.
Step 2: Create Relationships in Model View
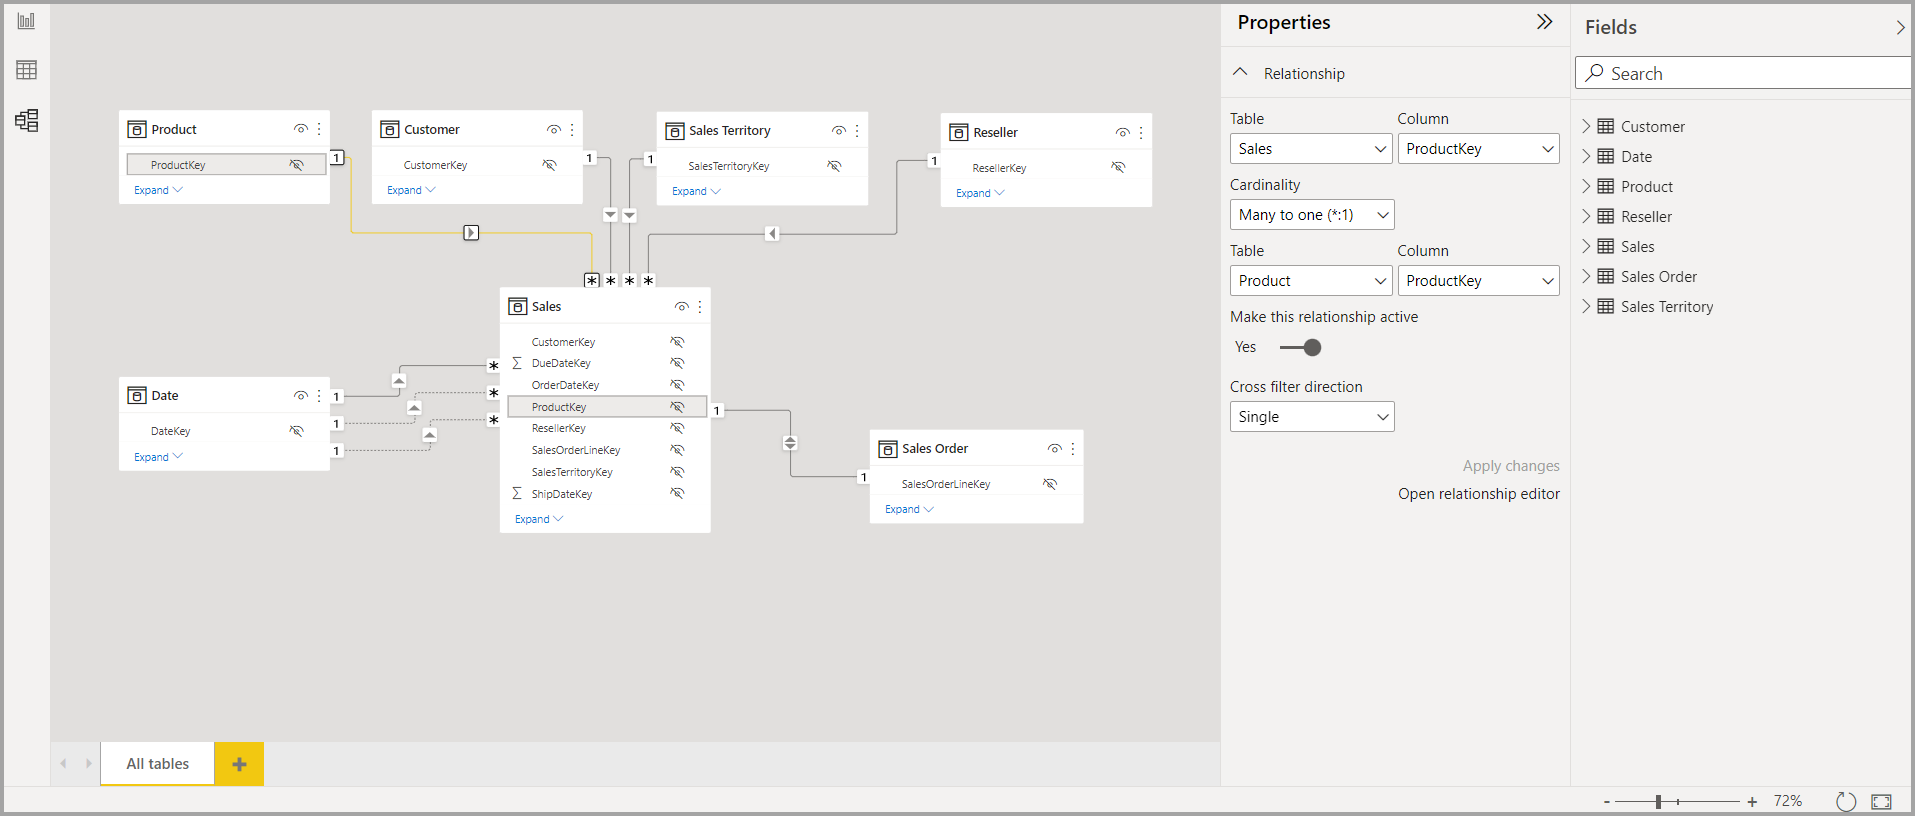
To create a relationship:
- Open Model View
- Drag the matching field from one table to another
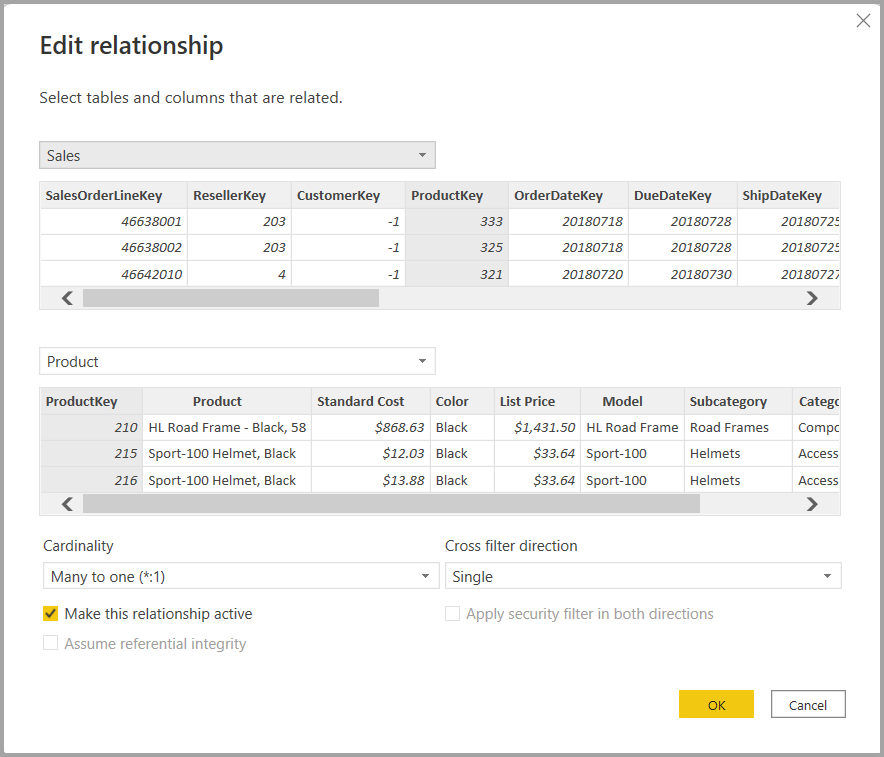
- Confirm relationship type
- Set filter direction
Power BI automatically detects many relationships, but always verify them.

Step 3: Use a Star Schema Model
The best practice for Power BI modeling is the Star Schema.
This structure includes:
- Fact Table → Transactions (Sales, Orders)
- Dimension Tables → Products, Customers, Dates
Benefits
- Faster performance
- Easier DAX calculations
- Cleaner relationships
- Better scalability
This is the industry-standard model for BI dashboards.
Step 4: Add a Proper Date Table
A dedicated date table is essential for:
- YTD calculations
- Previous month comparisons
- Quarterly reports
- Time intelligence DAX
Example DAX Date Table
Calendar = CALENDAR(DATE(2024,1,1), DATE(2026,12,31))
This creates a reusable calendar dimension.
Common Data Modeling Mistakes
Avoid these common issues:
- Many-to-many relationships everywhere
- Circular relationships
- Missing date tables
- Duplicate keys in dimension tables
- Bi-directional filtering without need
These mistakes often lead to slow or incorrect dashboards.
Best Practices for Smarter Models
To build professional data models:
- Use star schema
- Keep dimension tables clean
- Avoid unnecessary columns
- Create a proper date table
- Use surrogate keys where needed
- Name tables clearly
A clean model makes everything easier.
How Better Models Improve Dashboards
A strong data model improves:
- DAX performance
- Dashboard speed
- Filter accuracy
- Drill-through analysis
- User trust in reports
The better the model, the smarter the dashboard behaves.
Conclusion
Data modeling is one of the most important Power BI skills. While visuals attract attention, the relationships behind them determine whether your dashboard delivers trustworthy insights.
By mastering relationships, star schema design, and proper date tables, you can build smarter, faster, and more scalable dashboards that perform like enterprise BI solutions.