
One of the most powerful features in Power BI is the ability to move from a summary dashboard into deeper details with just one click. This feature is called Drill-Through.
Instead of overwhelming users with too much information on one page, drill-through reports allow them to start with high-level KPIs and then navigate into detailed reports for specific categories, regions, products, or customers.
This creates a much better user experience and makes dashboards feel professional and interactive.
In this article, you’ll learn how to create drill-through pages in Power BI and how to use them to build smarter reports.
What is Drill-Through in Power BI?
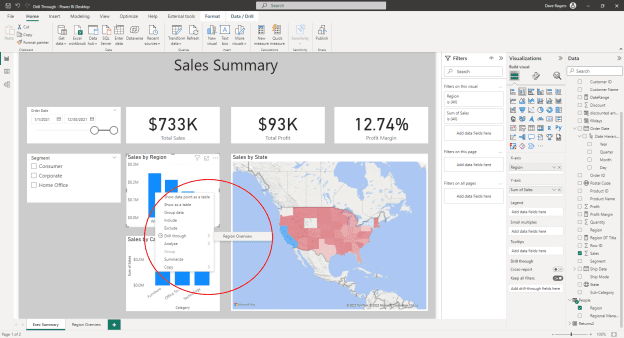
Drill-through allows users to right-click a data point in one visual and jump to a detailed page filtered for that exact selection.
What it is used for
- Region → detailed regional sales
- Product → detailed product performance
- Customer → full customer transaction history
- Department → staff-level KPIs
This helps users move from summary → detail instantly.

Why Drill-Through Makes Dashboards Better
Drill-through improves dashboards because it:
- Reduces clutter on the main page
- Keeps summary dashboards clean
- Enables deeper investigation
- Improves storytelling with data
- Makes reports easier for executives
Instead of creating many overloaded visuals, you guide users into layers of insight.
Step 1: Create a Detail Page
Start by creating a new report page that will serve as the detail view.
This page may include:
- Detailed tables
- Product-level charts
- Customer transaction visuals
- Trend analysis
This is where users land after drilling through.
Step 2: Add Drill-Through Fields
On the detail page:
- Go to the Drill-through filters pane
- Drag the desired field into it
Example fields
- Region
- Product Name
- Customer Name
- Sales Rep
What this is used for
This tells Power BI what value should control the drill-through page.
Step 3: Build the Detailed Visuals
Now add visuals that should respond to the selected drill-through value.
For example, if drilling through by Region, include:
- Region sales trend
- Top products in region
- Customer count
- Monthly growth
This creates a focused detail experience.
Step 4: Add a Back Button
A professional drill-through page should always include a Back button.
Steps
- Go to Insert
- Select Buttons
- Choose Back
This helps users return to the main dashboard easily.
How Users Interact with Drill-Through
Users simply:
- Right-click a chart value
- Select Drill-through
- Choose the detail page
Power BI automatically filters the destination page.
Example
A user right-clicks North Region Sales and jumps to a page showing only North region details.
This creates an intuitive user experience.
Best Use Cases for Drill-Through
Drill-through is excellent for:
- Sales dashboards
- Customer analytics
- Product performance reports
- HR dashboards
- Financial statements
It works best where executives need both summary and detail.
Best Practices
To use drill-through effectively:
- Keep the main page simple
- Use meaningful drill-through fields
- Add clear page titles
- Always include a back button
- Avoid too many drill paths
The goal is clarity, not confusion.
Common Mistakes to Avoid
- Missing back buttons
- Overloading detail pages
- Using too many drill-through fields
- No clear business purpose
Always design drill-through around user questions.
Conclusion
Drill-through reports are one of the best ways to make Power BI dashboards feel interactive and enterprise-ready. They allow users to move from summary KPIs into rich detailed analysis without cluttering the main report page.
By mastering drill-through, you create reports that are cleaner, smarter, and far more useful for decision-making.
This is a feature every Power BI professional should know.