
A slow dashboard can ruin the entire user experience. No matter how beautiful your visuals are, if users have to wait for them to load, the report becomes frustrating and ineffective.
In Power BI, performance optimization is a critical skill that separates beginners from professionals.
In this article, you’ll learn why dashboards become slow, how to fix them, and best practices for building fast, efficient reports.
Why Power BI Dashboards Become Slow
Several factors can affect performance:
- Large datasets
- Poor data models
- Inefficient DAX calculations
- Too many visuals on one page
- Unoptimized relationships
Understanding these issues is the first step to fixing them.
Using Performance Analyzer
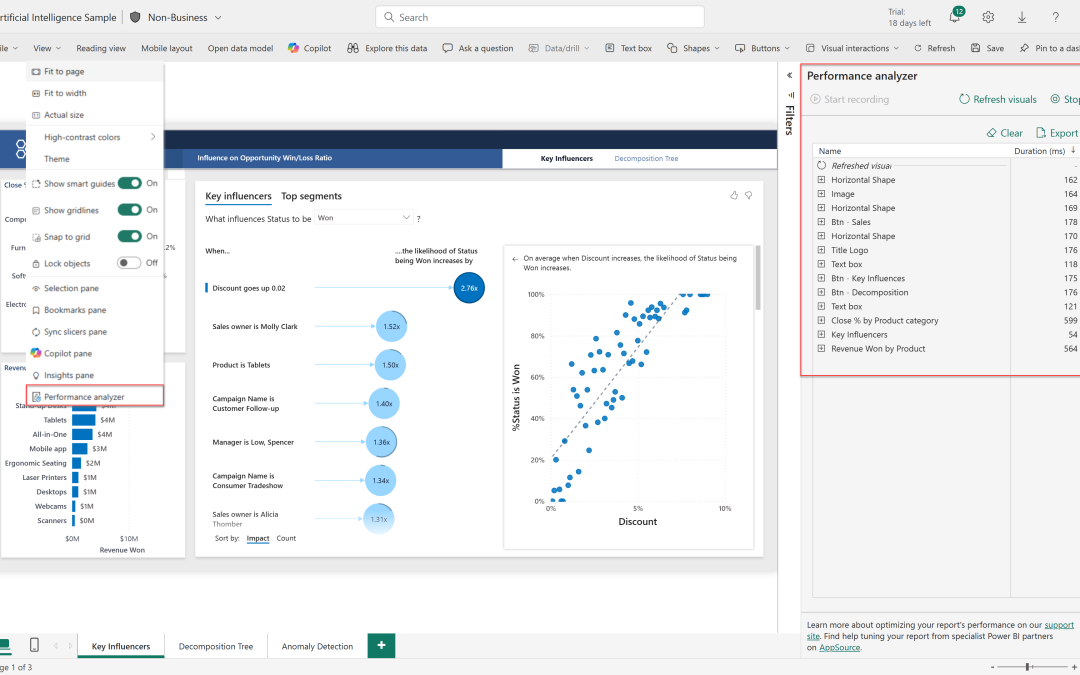
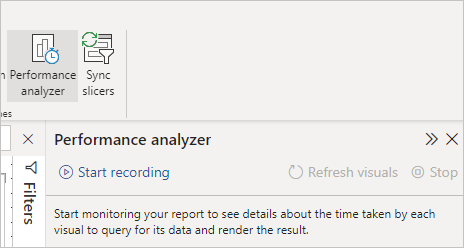
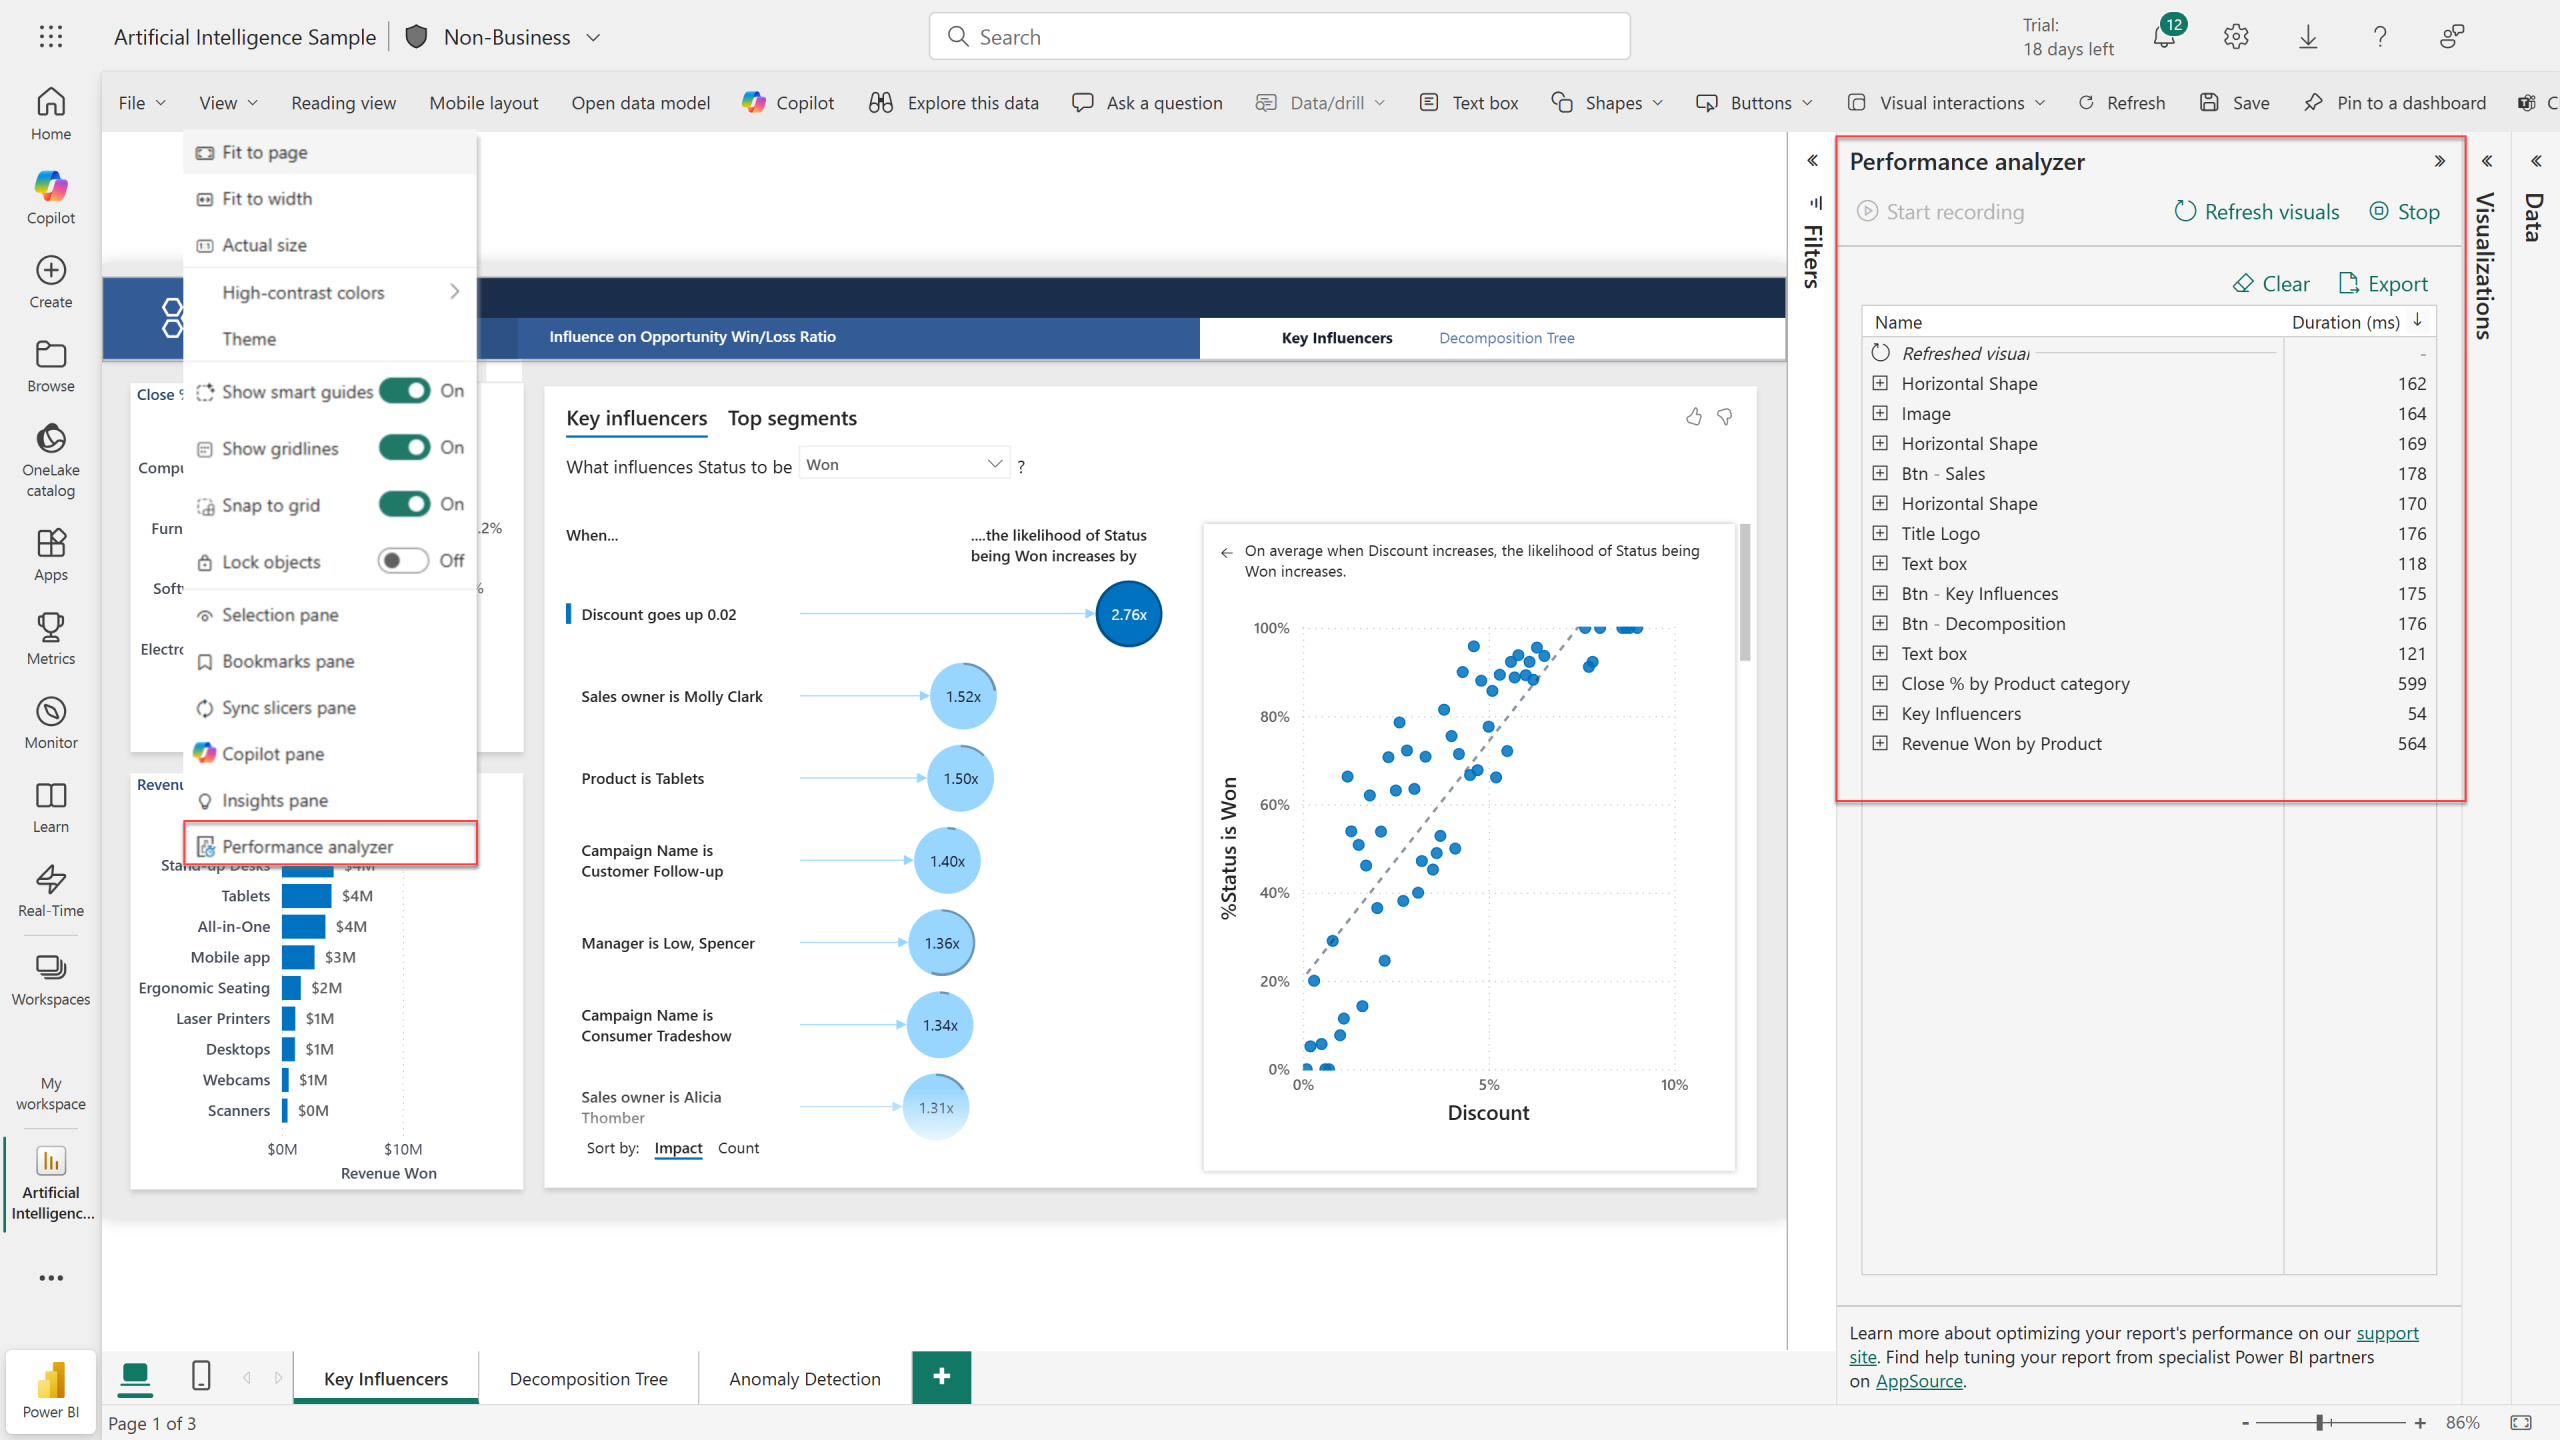
Power BI provides a built-in tool called Performance Analyzer.
What it is used for
- Measuring visual load time
- Identifying slow visuals
- Analyzing DAX queries
Steps:
- Go to View → Performance Analyzer
- Click Start Recording
- Interact with your report
- Review results
This helps you pinpoint exactly where the problem is.
Optimize Your Data Model
A clean data model improves performance significantly.
Best practices:
- Use Star Schema
- Remove unnecessary columns
- Avoid duplicate tables
- Use proper relationships
A well-structured model reduces memory usage and speeds up calculations.
Reduce Data Size
Large datasets slow down reports.
How to reduce size:
- Filter data during import
- Remove unused columns
- Use aggregated tables
Smaller datasets load faster and perform better.
Optimize DAX Measures
Poorly written DAX can slow down visuals.
Tips:
- Avoid complex nested formulas
- Use variables (
VAR) - Reuse measures instead of repeating logic
Example:
Total Profit =
VAR Revenue = SUM(Sales[Revenue])
VAR Cost = SUM(Sales[Cost])
RETURN Revenue - Cost
This improves readability and performance.
Limit Visuals Per Page
Too many visuals increase load time.
Recommendation:
- Keep visuals between 5–8 per page
- Use drill-through instead of overcrowding
- Avoid unnecessary charts
Use Aggregations
Aggregations summarize large datasets into smaller tables.
What they are used for:
- Faster query performance
- Handling big data
- Improving responsiveness
Best Practices
- Optimize data before importing
- Use measures instead of calculated columns
- Disable unnecessary interactions
- Use proper data types
Common Mistakes to Avoid
- Importing too much data
- Using many-to-many relationships unnecessarily
- Writing inefficient DAX
- Ignoring performance testing
Conclusion
Performance optimization is essential for professional Power BI dashboards. Fast dashboards improve user experience, increase adoption, and make your reports more effective.