

In the world of data, SQL (Structured Query Language) remains the backbone of analysis, powering everything from financial reporting to e-commerce dashboards and mobile-app analytics. Whether you are a business analyst, data scientist, marketer, developer, or someone transitioning into tech, SQL is often the first and most essential skill you must master.
SQL allows organizations to extract meaning from the massive volumes of data stored in relational databases. Behind every sales report, customer segmentation, performance dashboard, or forecasting model lies a series of SQL queries pulling the right information at the right time.
SQL is not just a tool — it is the language of data.

What Is SQL for Data Analysis?
SQL for data analysis refers to using SQL to:
- query and extract data
- filter and organize information
- combine multiple tables
- summarize large datasets
- create actionable insights
- support decision-making
It is the foundation of modern analytics because vast amounts of business data live in SQL-based databases such as:
- MySQL
- PostgreSQL
- SQL Server
- Oracle
- MariaDB
- Snowflake
- BigQuery
These systems store data in tables similar to spreadsheet sheets — but much larger, more structured, and far more scalable.
Why Analysts Use SQL
SQL gives analysts the ability to:
- retrieve millions of rows in seconds
- join tables to see relationships
- calculate KPIs and metrics
- detect patterns, trends, and anomalies
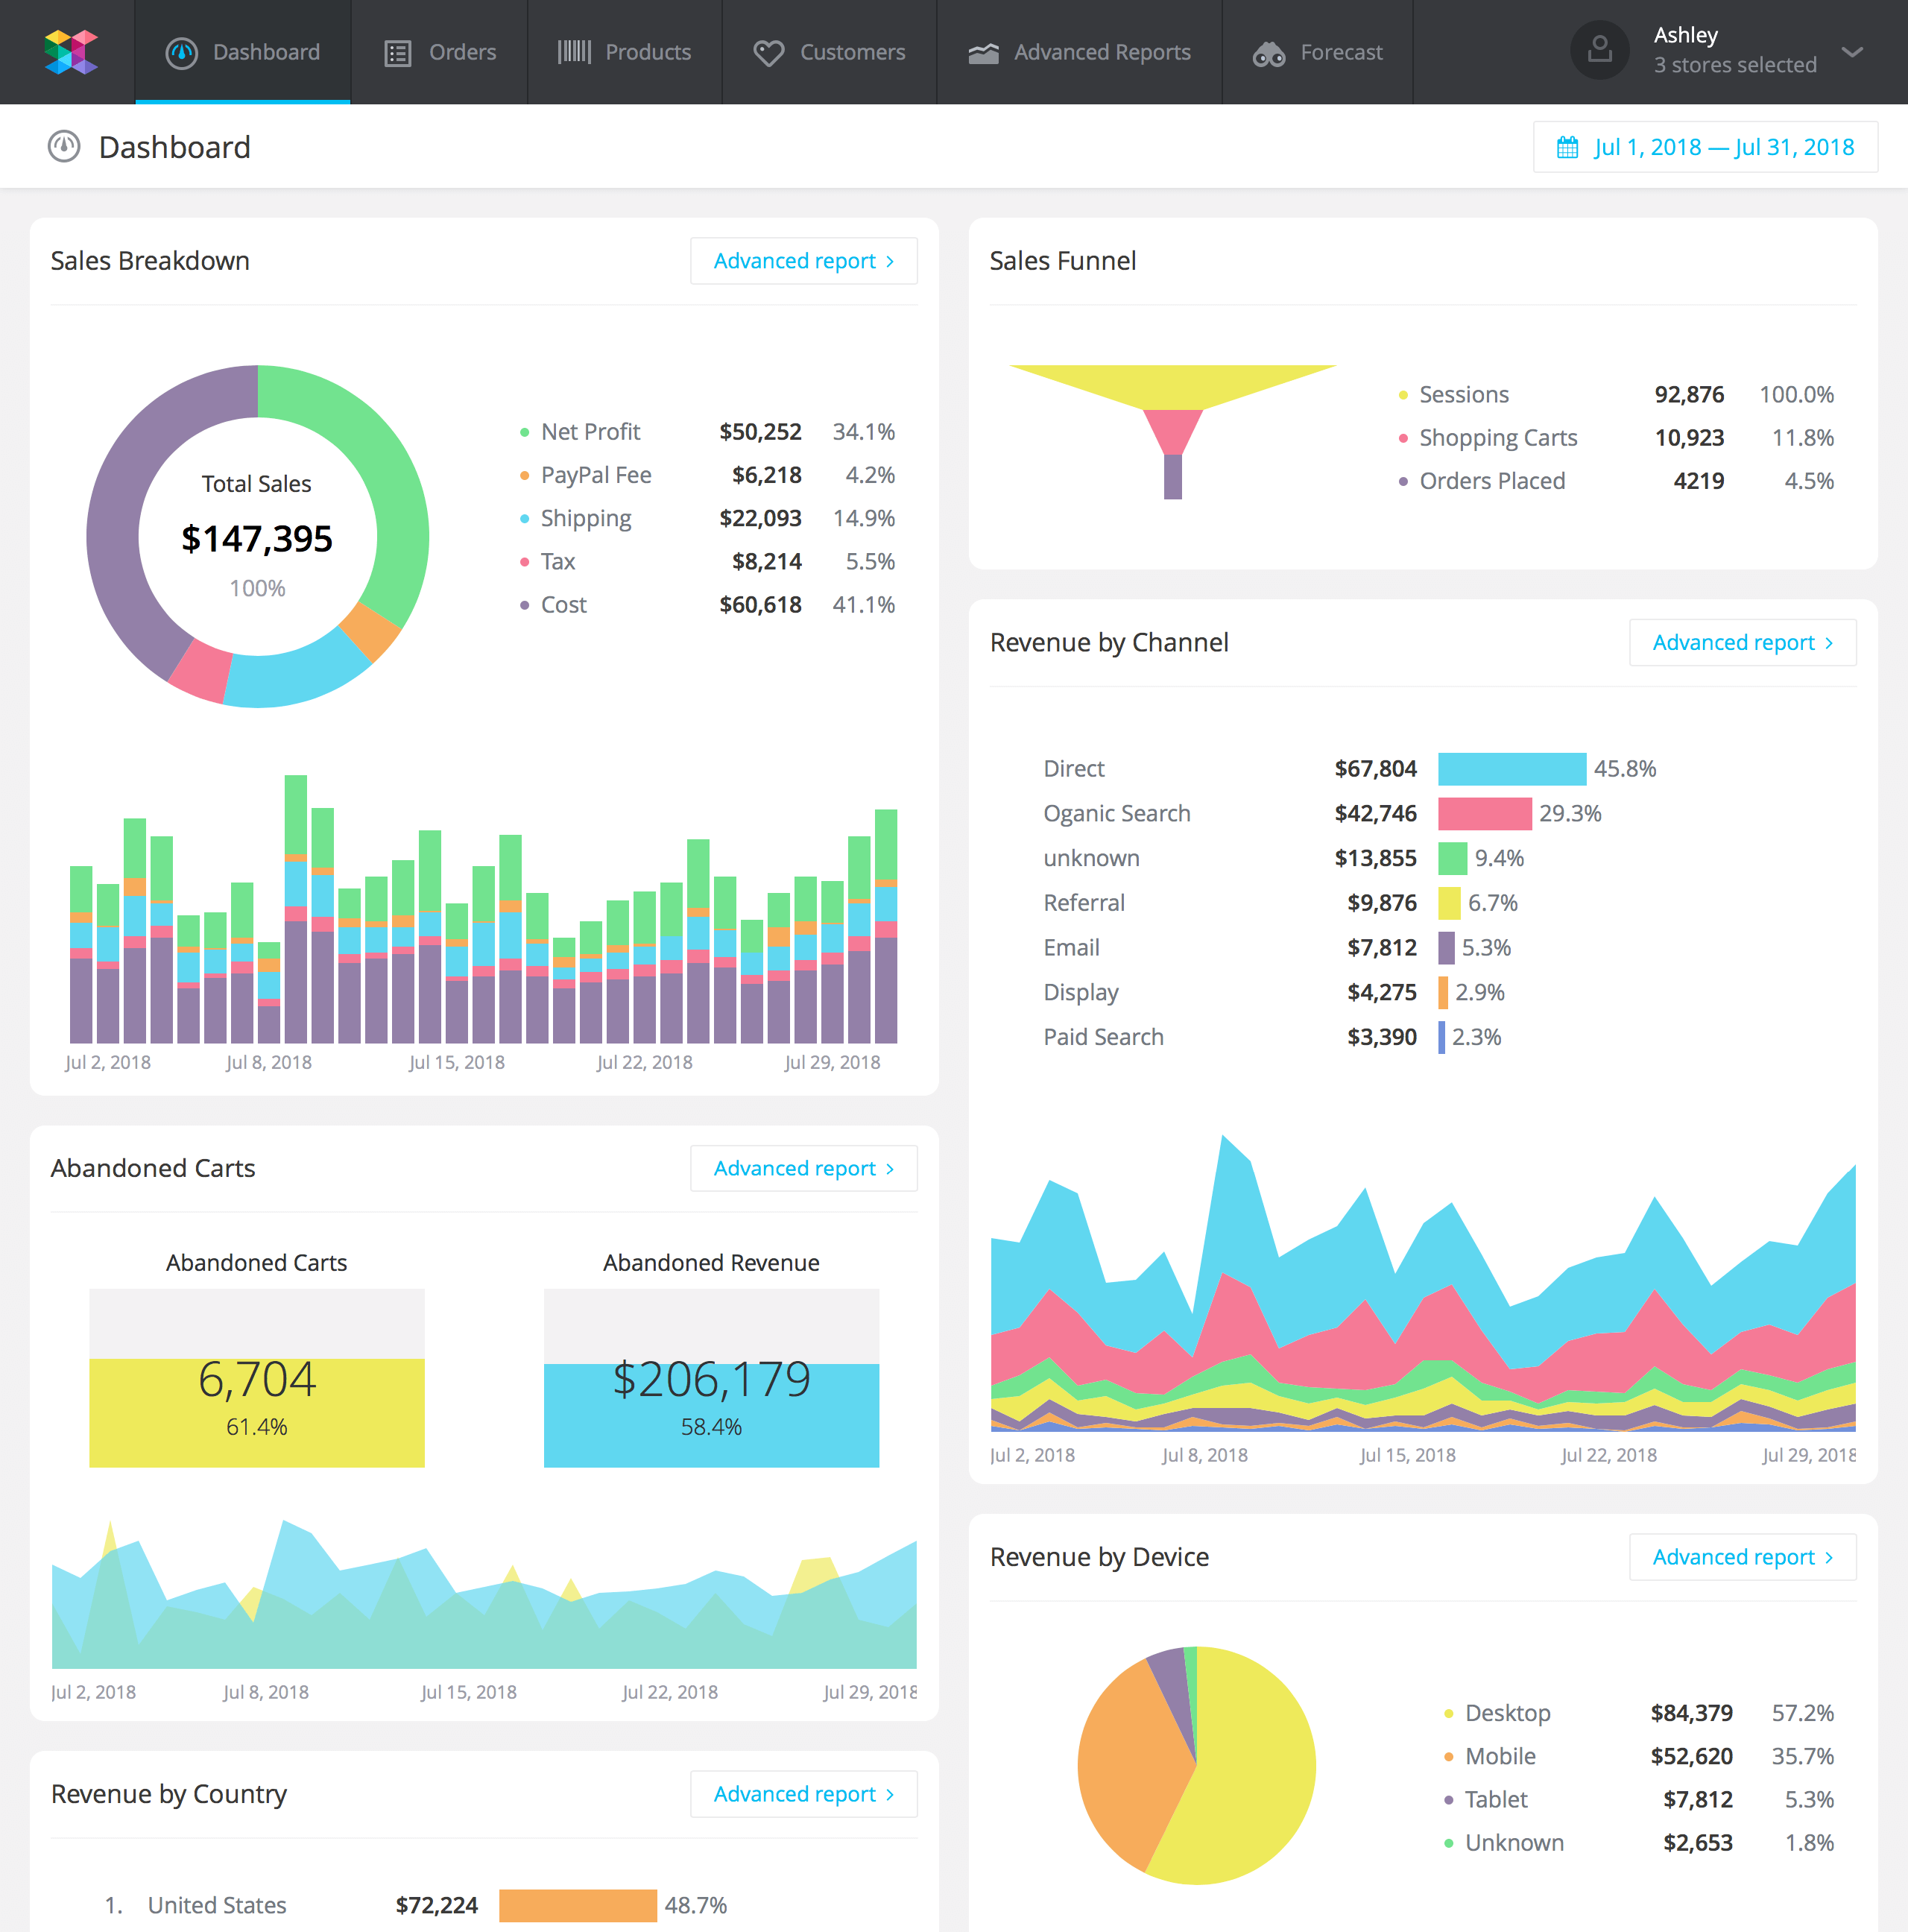
- prepare data for visualization tools such as dashboards
Even many popular tools — from CRM systems to analytics engines — rely on SQL behind the scenes to serve data requests.
How SQL Works — The Analyst’s Workflow
Below is the typical workflow an analyst follows when using SQL to transform raw data into insights.
1. Data Collection (SELECT Statements)
SQL retrieves exactly the data you need using the SELECT command.
Example:
SELECT name, age, salary
FROM employees;
This simple but powerful statement is the foundation of all SQL analysis — pulling information from the database efficiently and accurately.

2. Filtering and Cleaning (WHERE, DISTINCT, LIKE)
SQL allows analysts to refine and clean data before analysis. You can:
- remove duplicates
- filter for specific date ranges
- correct inconsistent values
- extract relevant segments
SELECT DISTINCT product_name
FROM sales
WHERE date >= '2024-01-01';
This step helps ensure that your data is accurate, relevant, and ready for deeper analysis.
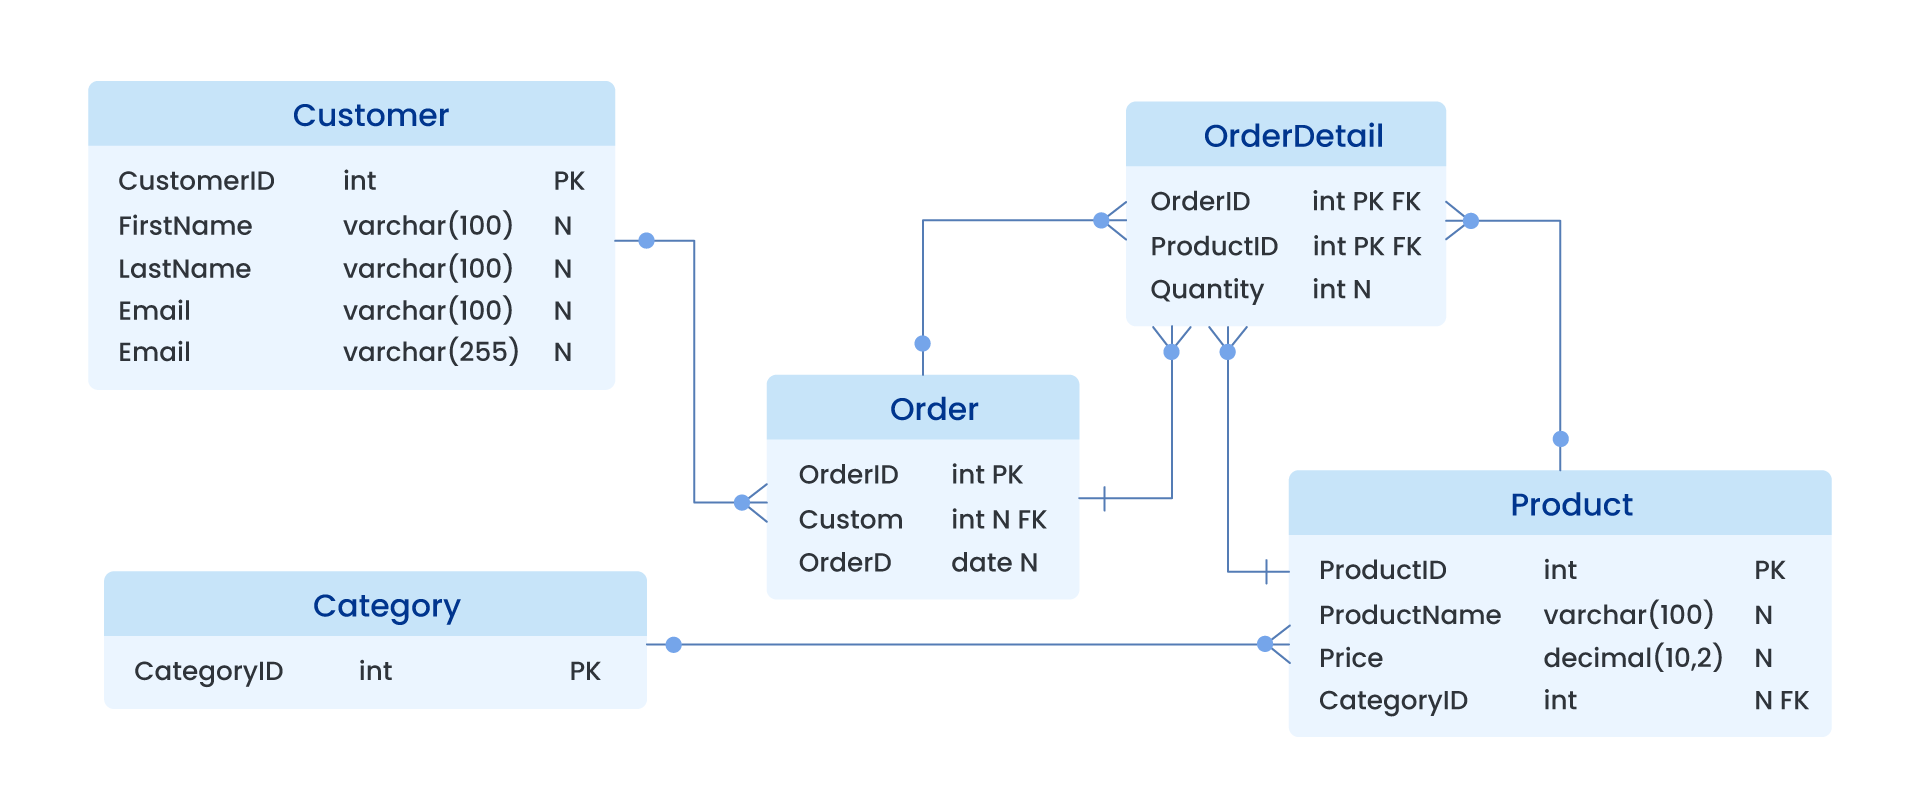
3. Combining Multiple Tables (JOINS)
Most data is stored across several tables. SQL lets you combine these tables using:
INNER JOINLEFT JOINRIGHT JOINFULL JOIN
Example:
SELECT customers.name, orders.order_amount
FROM customers
INNER JOIN orders
  ON customers.customer_id = orders.customer_id;
This capability is how analysts connect related data — for example, linking customer behavior with sales, or matching products to revenue.

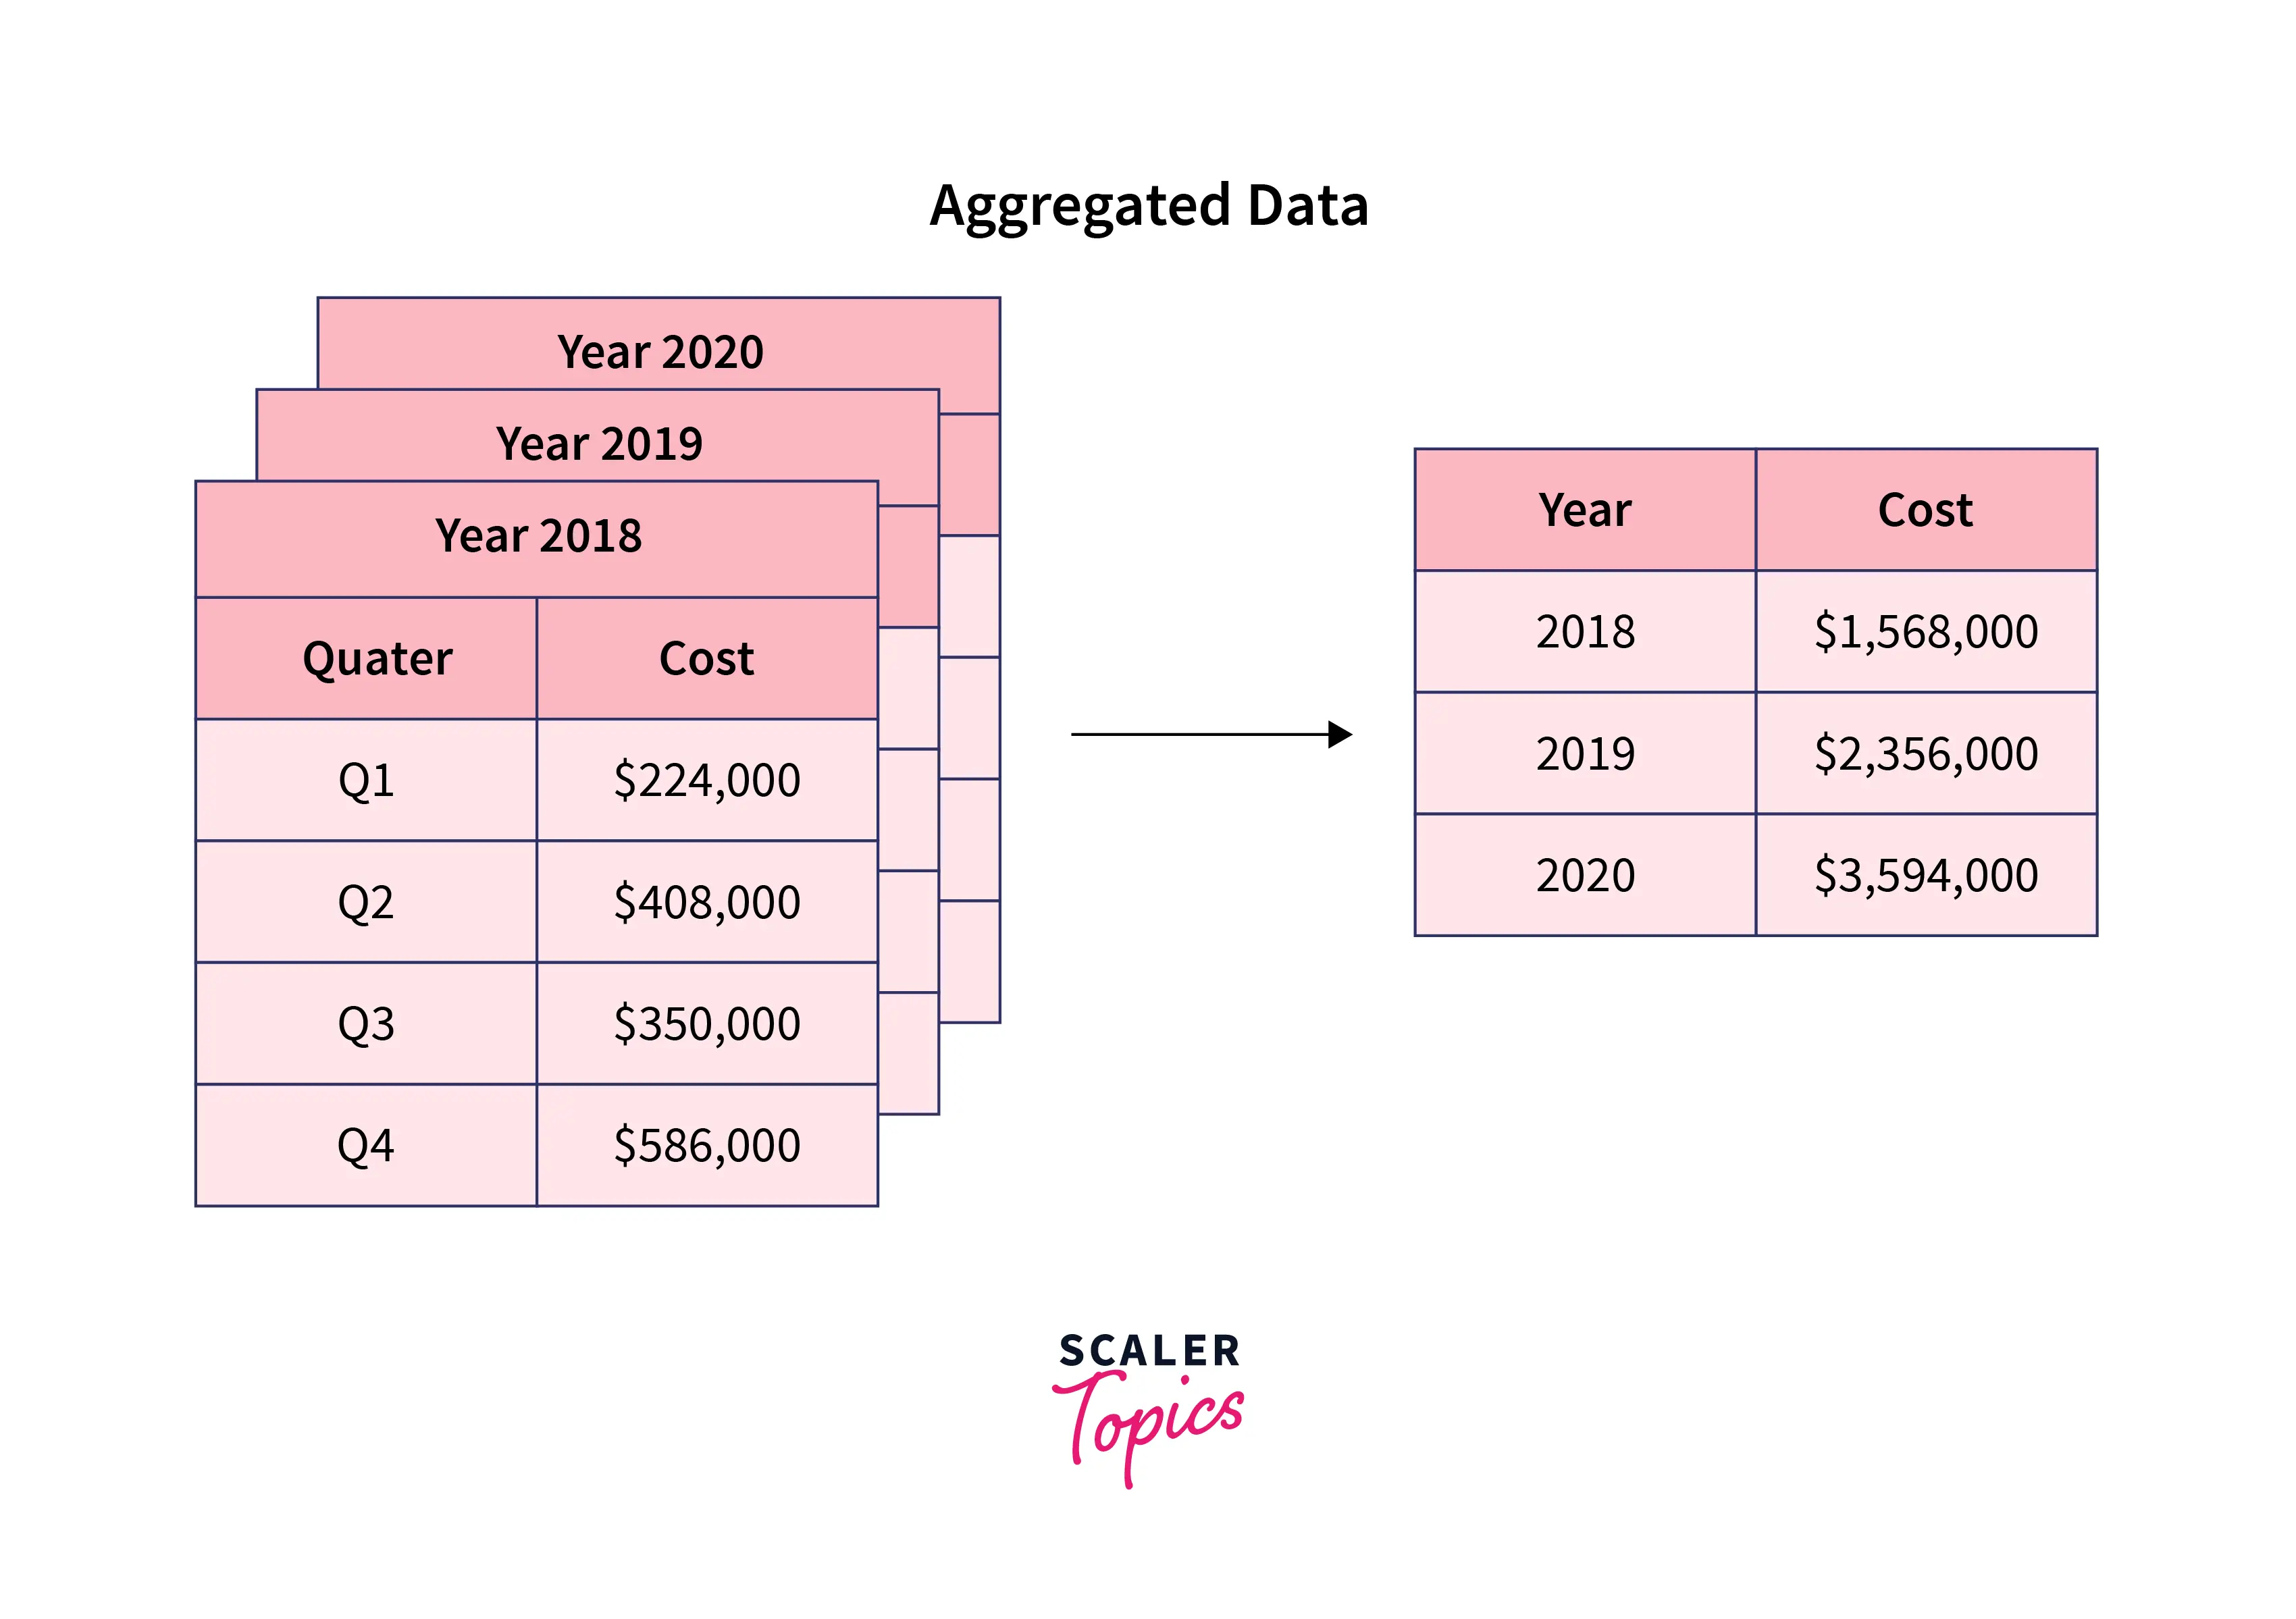
4. Summarizing Data (GROUP BY, HAVING)
SQL can generate powerful business insights through aggregation:
SUM()COUNT()AVG()MIN()/MAX()
Example:
SELECT product_name, SUM(quantity) AS total_sold
FROM sales
GROUP BY product_name
ORDER BY total_sold DESC;
This lets you see top-performing products, regions, departments, or time periods — essential for business intelligence and reporting.
5. Sorting, Ranking, and Categorizing Data
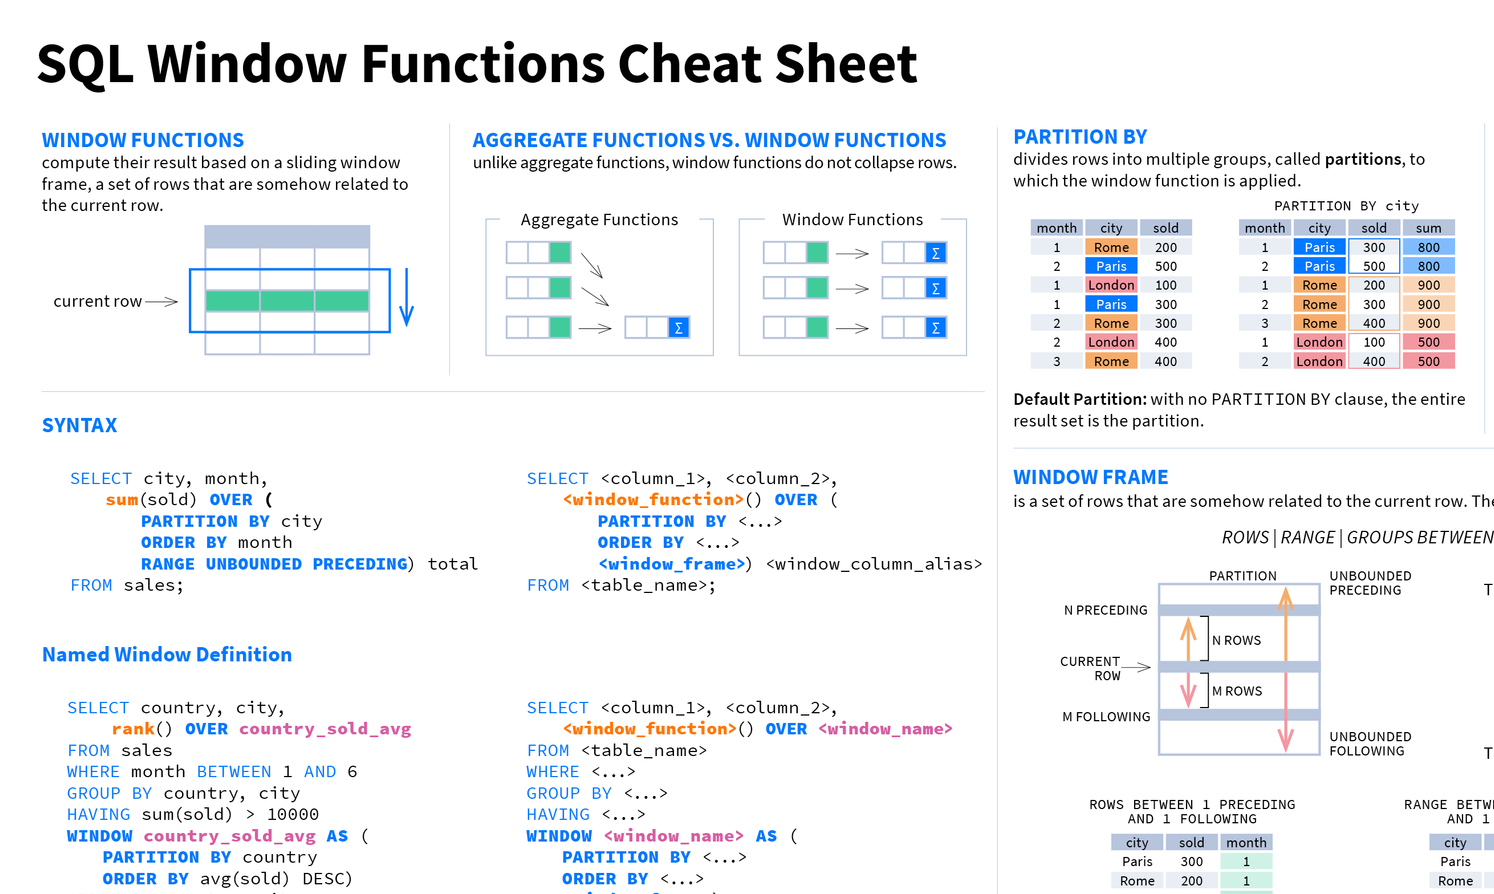
SQL supports deeper analytic patterns using commands like:
ORDER BY- Conditional logic (
CASE WHEN) - Window and ranking functions (
OVER,PARTITION BY)
Example:
SELECT
  employee,
  salary,
  RANK() OVER (ORDER BY salary DESC) AS salary_rank
FROM employees;
This kind of query is often used in executive dashboards, performance reviews, or any report where ranking or classification matters.
6. Visualization and Reporting
Once SQL extracts the data, results can be sent to visualization or reporting tools such as:
- Dashboard tools
- Spreadsheet apps
- Data-visualization libraries
- Reporting platforms
SQL acts as the engine that powers dashboards and reports — turning raw data into clean, understandable insights.
Is SQL Reliable for Data Analysis?
Absolutely. SQL has been the industry standard for decades and remains among the most trusted and widely used data-query languages in the world.
Reasons SQL is reliable:
- ✔ Accuracy & Consistency — SQL retrieves data exactly as stored, ensuring precision.
- ✔ Scalability — Handles datasets ranging from a few rows to billions without a problem.
- ✔ Security — Most SQL databases provide role-based access, encryption, and audit trails.
- ✔ Reproducibility — Queries can be saved, reused, automated, and shared across individuals or teams.
- ✔ Compatibility — Integrates smoothly with cloud platforms and many analytics/reporting tools.
From finance to tech to healthcare, SQL forms the backbone of nearly every data-driven ecosystem.

Why Analysts Use SQL Over Excel, Python, or NoSQL
Many analysts rely on SQL because:
- SQL handles bigger datasets than Excel — Excel becomes slow or unwieldy with large volumes; SQL scales gracefully.
- SQL is often simpler than writing full code — Basic queries use straightforward, English-like syntax (SELECT, FROM, WHERE, JOIN, etc.).
- SQL remains essential even when using languages like Python — Most data workflows still start with SQL to pull and clean data.
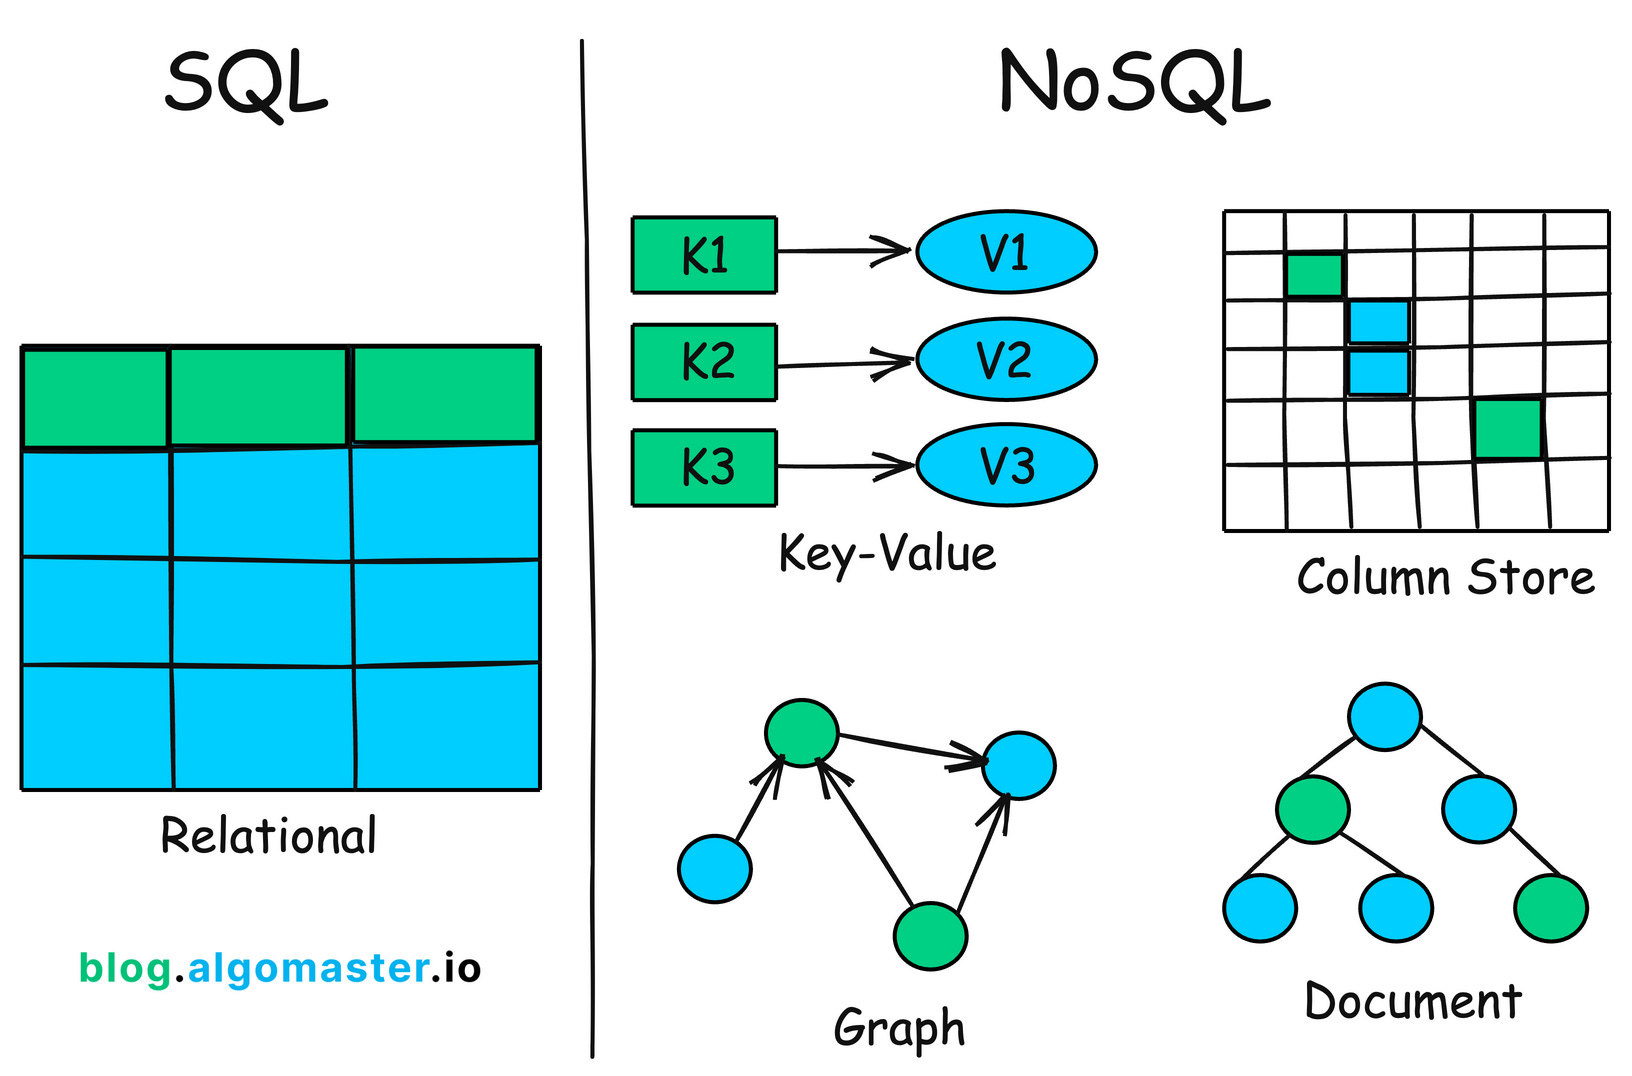
- Relational databases are still the gold standard for structured data — NoSQL has its strengths, but for structured, relational data, SQL databases remain dominant.
- Wide integration — Nearly all reporting tools and BI platforms expect data from SQL queries, making SQL a universal foundation.
Real-World Uses of SQL in Data Analysis
SQL is widely used in many industries. Here’s how:
📌 Finance
- Credit scoring
- Revenue forecasting
- Fraud detection
- Loan and risk analysis
📌 Marketing & Business Intelligence
- Customer segmentation
- Campaign performance analysis
- CAC (Customer Acquisition Cost) and ROI calculations
📌 E-commerce
- Identifying best-selling products
- Customer retention and lifetime value metrics
- Inventory predictions and restocking analytics
📌 Healthcare & Research
- Patient data analytics
- Research dataset processing and statistical reporting
📌 Tech & Product Analytics
- App usage tracking
- A/B testing analytics
- Feature performance insights
If a company stores data, it’s nearly certain SQL is already part of their analytics stack.
Limitations of SQL (Important for Analysts)
Even though SQL is powerful, it has some constraints:
- Not ideal for advanced statistical modeling or machine learning — languages like Python or R are better suited for those tasks.
- Can get complex with deeply nested queries or very sophisticated data transformations.
- Limited when dealing with unstructured data; SQL shines with structured relational data, but struggles with flexible schema-less data.
- Real-time streaming data or very high-concurrency use-cases may require specialized tools beyond traditional SQL databases.
Still — given its strengths — SQL remains the foundation for most data analysis workflows worldwide.
Final Verdict
SQL is the most essential language in data analysis, enabling professionals to extract meaning from massive datasets with speed, precision, and scalability. Whether you’re analyzing sales, tracking performance, building dashboards, or supporting executive decisions — SQL provides the structure and power to turn raw tables into business intelligence.
If you want to understand data, communicate insights, and drive informed decisions across any industry, SQL is not just useful — it’s a necessity.