

Visualizing data geographically can reveal insights that ordinary tables and charts may not easily show. Microsoft Excel includes a powerful feature called Map Charts, which allows users to display location-based data on a map.
With map charts, you can visualize information such as sales by country, population by region, or customer distribution across different locations.
This makes data easier to understand and helps identify patterns based on geography.
What is a Map Chart in Excel?
A Map Chart is a type of chart that displays data across geographic regions. Excel automatically recognizes location names and plots them on a map.
Map charts work best with data that includes geographic information such as:
- Countries
- States or provinces
- Cities
- Regions
- Postal codes
Excel then uses this location data to create a filled map where different areas are shaded based on values.
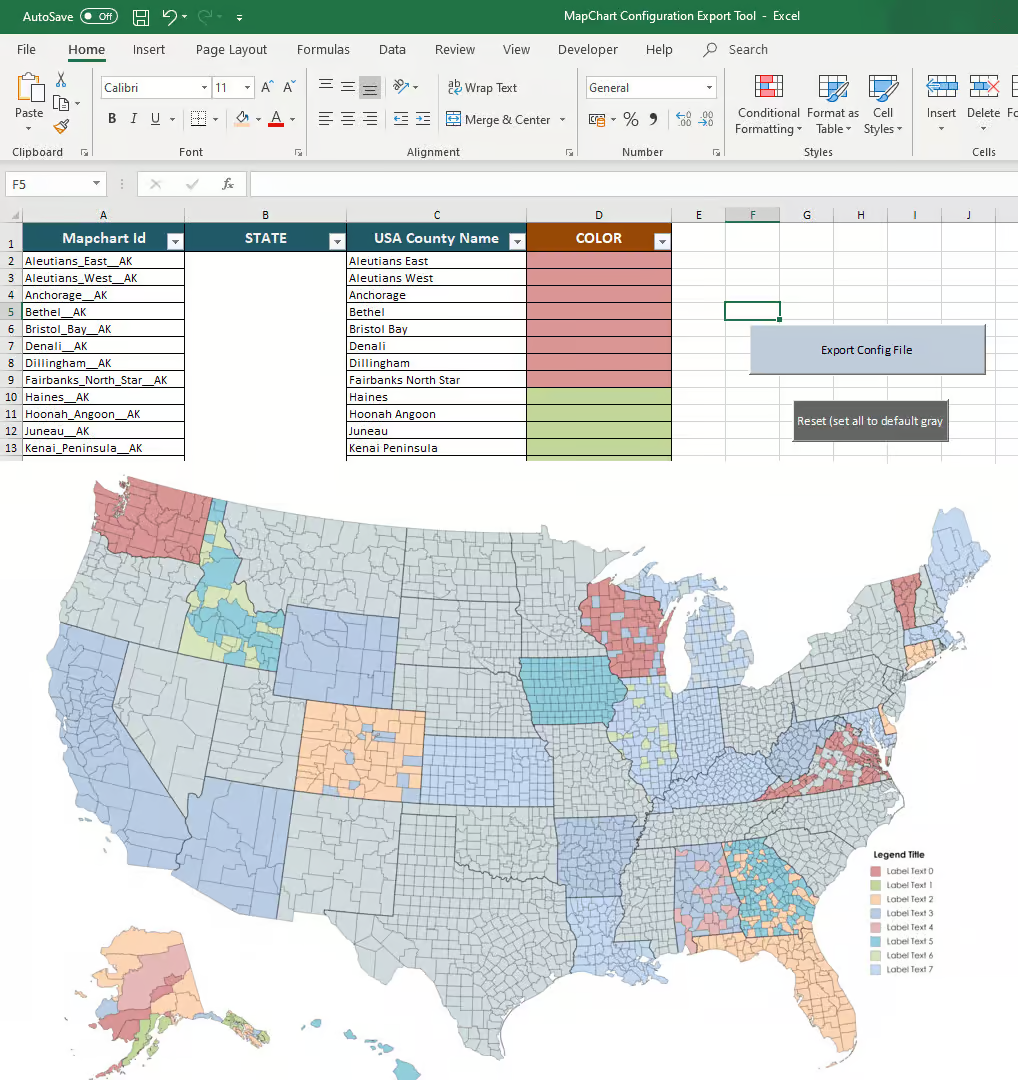
Preparing Data for a Map Chart
Before creating a map chart, you need to organize your data properly.
Your dataset should include:
- Location names
- Corresponding values
Example dataset:
Country | Sales
USA | 12000
Canada | 8500
UK | 9000
Germany | 7000
Excel will recognize the country names and use them to generate a map.
How to Create a Map Chart
Follow these steps to create a map chart in Excel:
- Select the dataset containing location data.
- Go to the Insert tab on the ribbon.
- Click Maps in the Charts section.
- Select Filled Map.
Excel will automatically generate a map visualization based on your data.

Customizing Your Map Chart
Excel allows you to customize map charts to make them more informative.
You can modify:
- Map colors
- Data labels
- Chart title
- Map area
For example, higher values can appear in darker colors while lower values appear in lighter shades. This helps users quickly identify trends across regions.

Using Map Charts for Data Analysis
Map charts are especially useful for analyzing geographic trends.
They are commonly used for:
- Sales performance by region
- Population analysis
- Market expansion planning
- Customer distribution analysis
- Regional performance tracking
For example, a company might use a map chart to identify which regions generate the most revenue.
Common Issues When Creating Map Charts
Sometimes Excel may not recognize location names correctly.
This can happen if:
- Locations are misspelled
- Regions have similar names
- Data is incomplete
To fix this:
- Ensure location names are correct
- Include additional geographic information if necessary (for example, both country and state)
Best Practices for Map Charts
To create effective map charts:
- Use clear geographic data
- Avoid overcrowding the map
- Use appropriate color scales
- Include a clear chart title
- Keep the dataset organized
These practices make the map easier to interpret.
Conclusion
Map charts in Excel provide a powerful way to visualize geographic data. By transforming location-based datasets into interactive maps, users can quickly identify regional trends and patterns.
Whether analyzing sales by country or studying population distribution, Excel’s map charts help turn raw data into meaningful geographic insights.