

Power BI is powerful for visualization, but its true strength lies in DAX (Data Analysis Expressions). DAX allows you to move beyond basic totals and create intelligent, dynamic, and business-ready calculations.
This article explains what DAX is, how it works, the most important DAX functions, and when to use them in real-world reporting.
What Is DAX?
DAX (Data Analysis Expressions) is a formula language used in:
- Power BI
- Power Pivot (Excel)
- SQL Server Analysis Services (SSAS)
DAX is used to create:
- Calculated Columns (row-level calculations stored in the model)
- Measures (dynamic calculations that respond to filters)
- Calculated Tables
Unlike Excel formulas, DAX is optimized for relational data models and interactive reporting.
Calculated Columns vs Measures
Understanding this difference is critical.
🔹 Calculated Columns
- Calculated row by row
- Stored in memory
- Increase model size
Example:
Profit = Sales[Revenue] - Sales[Cost]
What it does:
Subtracts cost from revenue for each row.
When to use it:
When you need a permanent column that will be used in slicers, relationships, or grouping.
🔹 Measures
- Calculated dynamically
- Respond to filters and slicers
- Do not increase file size significantly
Example:
Total Sales = SUM(Sales[Revenue])
What it does:
Adds up all values in the Revenue column.
When to use it:
When you need totals, averages, KPIs, or dynamic aggregations in visuals.
Essential DAX Functions and What They Are Used For
1️⃣ SUM()
Total Sales = SUM(Sales[Revenue])
What it does:
Adds all numbers in a numeric column.
When to use it:
To calculate totals such as revenue, expenses, quantity sold.
2️⃣ AVERAGE()
Average Sales = AVERAGE(Sales[Revenue])
What it does:
Calculates the mean of values in a column.
When to use it:
To determine average performance, average order value, or average cost.
3️⃣ COUNT() and DISTINCTCOUNT()
Total Orders = COUNT(Sales[OrderID])
What it does:
Counts non-blank rows.
Unique Customers = DISTINCTCOUNT(Sales[CustomerID])
What it does:
Counts unique values only.
When to use them:
- COUNT → total transactions
- DISTINCTCOUNT → number of unique customers
4️⃣ IF() — Logical Decision Function
Sales Category =
IF([Total Sales] > 100000, "High", "Low")
What it does:
Returns one value if a condition is true, another if false.
When to use it:
To categorize data into performance groups, risk levels, or thresholds.
5️⃣ CALCULATE() — The Most Important DAX Function
Sales in Lagos =
CALCULATE(
    [Total Sales],
    Sales[City] = "Lagos"
)
What it does:
Changes the filter context before performing a calculation.
Why it matters:
It allows you to override or modify filters.
When to use it:
- Filtering calculations
- Creating conditional totals
- Building advanced KPIs
Without CALCULATE, advanced DAX analysis is impossible.
6️⃣ SAMEPERIODLASTYEAR() — Time Intelligence
Sales Last Year =
CALCULATE(
    [Total Sales],
    SAMEPERIODLASTYEAR(Calendar[Date])
)
What it does:
Returns values from the same date range in the previous year.
When to use it:
For year-over-year (YoY) comparisons.
This is essential for financial and business trend analysis.
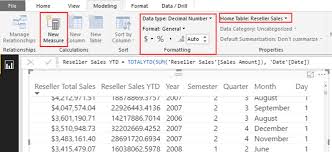
7️⃣ TOTALYTD() — Year-To-Date Calculations
Sales YTD =
TOTALYTD(
    [Total Sales],
    Calendar[Date]
)
What it does:
Calculates cumulative sales from the start of the year up to the selected date.
When to use it:
For tracking annual performance and progress toward targets.
Understanding Filter Context
Filter context determines how DAX calculates results.
Filter context comes from:
- Visuals
- Slicers
- Page filters
- Relationships
Example:
If a slicer selects 2025, the measure recalculates only for 2025.
This dynamic recalculation is what makes DAX powerful.
Using Variables (VAR) in DAX
Variables improve readability and performance.
Example:
Total Profit =
VAR Revenue = SUM(Sales[Revenue])
VAR Cost = SUM(Sales[Cost])
RETURN
Revenue - Cost
What it does:
Stores intermediate values before returning final calculation.
Why use it:
- Cleaner formulas
- Better debugging
- Improved performance
Best Practices When Writing DAX
- Prefer measures over calculated columns
- Use variables for complex logic
- Keep formulas readable
- Follow naming conventions
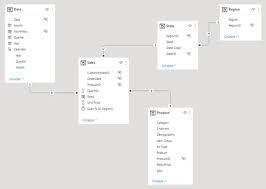
- Build a proper star schema model
DAX performs best when the data model is clean.
Conclusion
DAX transforms Power BI from a simple reporting tool into a powerful business intelligence engine. By understanding what each DAX function does and when to use it, you can build dynamic dashboards, advanced KPIs, and meaningful time-based analysis.
Mastering DAX is not about memorizing formulas — it is about understanding context, logic, and business requirements.