
Slicers in Microsoft Excel are powerful tools that allow users to filter data in tables, PivotTables, and PivotCharts interactively. They provide a visual, clickable interface that makes filtering easier, faster, and more intuitive than traditional filter menus.
This article explains how to use slicers effectively, key techniques, and best practices for enhancing data analysis in Excel.
Why Slicers Matter
Using slicers in Excel helps to:
- Make data filtering more intuitive and visual
- Quickly explore trends and insights in PivotTables and charts
- Improve presentation and interactivity of reports
- Simplify complex datasets for better understanding
Even well-structured data can be hard to analyze if filtering options are not user-friendly. Slicers bridge this gap with visual control.

Adding Slicers to PivotTables
Steps to add slicers:
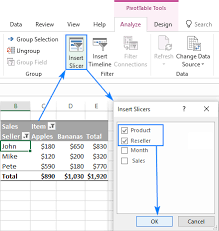
- Select your PivotTable.
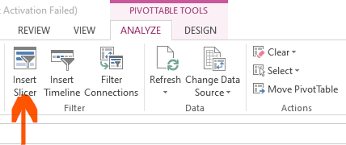
- Go to the PivotTable Analyze tab (or Options in older Excel versions).
- Click Insert Slicer.
- Choose the fields you want to filter by.
- Click OK — slicers will appear on your worksheet.
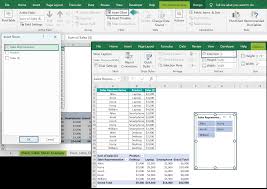
Once added, clicking buttons in the slicer filters the PivotTable immediately. Multiple slicers can be used together to filter data across several dimensions.
Customizing Slicers
Key customization options:
- Resize and reposition slicers for clarity and layout
- Change styles and colors to match report themes
- Adjust columns to display more items in a compact view
- Connect slicers to multiple PivotTables to filter multiple reports simultaneously
These customizations help maintain a clean, professional, and interactive report design.
Using Slicers with PivotCharts
Slicers are not limited to PivotTables—they can also control PivotCharts:
- Add slicers to filter chart data interactively
- Highlight trends dynamically without modifying the chart manually
- Combine multiple slicers to create interactive dashboards
This makes reports more engaging and allows stakeholders to explore data quickly.
Best Practices for Using Slicers
- Keep slicers visible and easy to access
- Use consistent colors to match your report theme
- Limit the number of slicers to avoid clutter
- Position slicers logically near the related table or chart
- Use descriptive field names for clarity
These practices ensure slicers enhance usability without overwhelming users.
Common Mistakes to Avoid
- Adding too many slicers at once, causing clutter
- Using inconsistent or distracting colors
- Ignoring alignment and sizing, making slicers hard to read
- Connecting slicers incorrectly, filtering unintended tables
Proper use of slicers ensures that dashboards and reports remain interactive and easy to interpret.
Conclusion
Slicers in Microsoft Excel transform ordinary PivotTables and PivotCharts into interactive, user-friendly reports. By using slicers thoughtfully, customizing their appearance, and following best practices, users can filter and explore data more efficiently. Mastering slicers not only improves report aesthetics but also enhances data-driven decision-making by making insights instantly accessible.