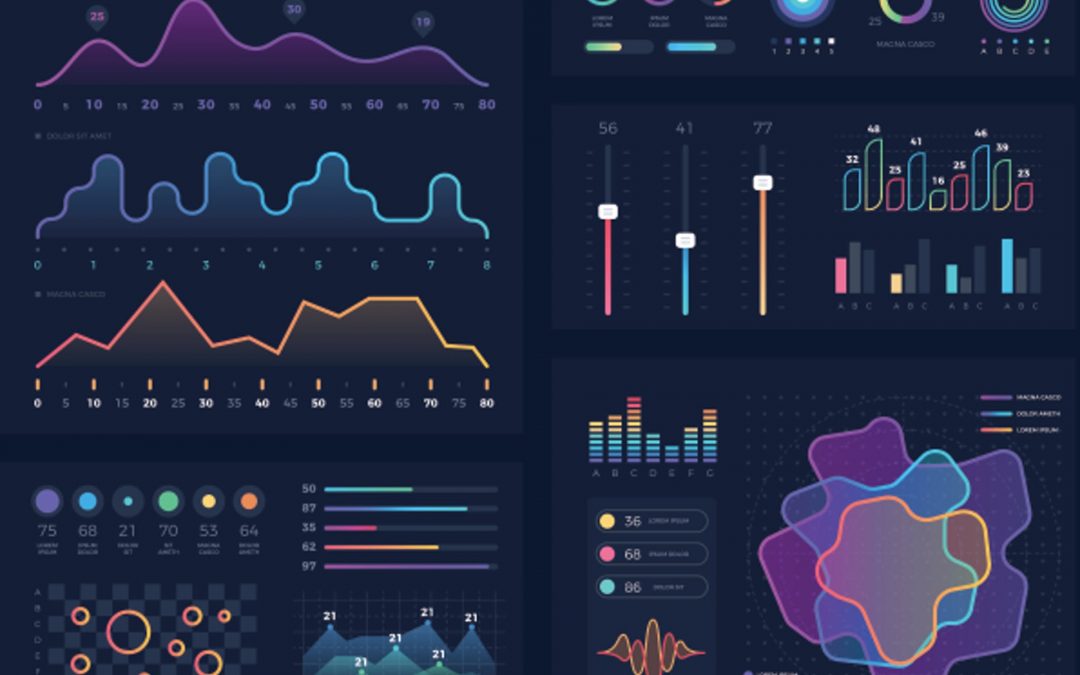
Data visualization is a general term that describes any effort to help people understand the significance of data by placing it in a visual context. Patterns, trends and correlations that might go undetected in text-based data can be exposed and recognized easier with data visualization software.
It has become the de facto standard for modern business intelligence. The success of the two leading vendors in the BI space, Tableau and Qlik — both of which heavily emphasize visualization — has moved other vendors toward a more visual approach in their software. Virtually all BI software has strong data visualization functionality.

Data visualization tools have been important in democratizing data and analytics and making data-driven insights available to workers throughout an organization. They are typically easier to operate than traditional statistical analysis software or earlier versions of BI software. This has led to a rise in lines of business implementing data visualization tools on their own, without support from IT.

