by Peter Obikpe | Dec 17, 2025 | Data Analysis
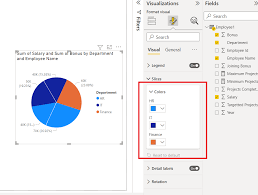
Pie charts are used to show proportions and percentages of a whole. They help viewers quickly understand how different categories contribute to a total. When used correctly, pie charts provide a simple and intuitive way to compare parts of a dataset. This article...

by Peter Obikpe | Dec 13, 2025 | Data Analysis
A stacked bar chart is used when you want to compare values across categories and see how each value is divided into sub-categories. Unlike a regular bar chart, stacked bars show both the total and the composition of that total in one visual. This article explains how...
by Peter Obikpe | Dec 13, 2025 | Data Analysis
Bar charts are one of the most commonly used visuals in Power BI. They are ideal for comparing values across categories and are especially effective when category names are long or when you want clear, easy-to-read comparisons. This article provides a complete,...
by Peter Obikpe | Dec 13, 2025 | Data Analysis, Mysql Database Articles
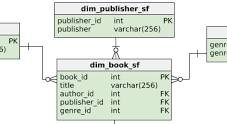
As SQL databases grow, writing long queries repeatedly becomes inefficient and hard to manage. To solve this, SQL provides reusable database objects such as Views, Stored Procedures, and Functions. These objects help you: Simplify complex queries Improve performance...
by Peter Obikpe | Dec 13, 2025 | Data Analysis
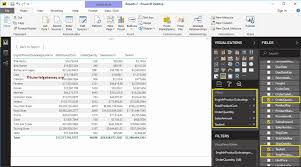
While charts are excellent for visual storytelling, tables are essential when users need to see exact values, detailed records, and multiple fields at once. Table visuals allow you to present structured data clearly and accurately, making them indispensable for...

by Peter Obikpe | Dec 13, 2025 | Data Analysis, Mysql Database Articles
Good table design is the foundation of every successful database. Whether you’re building a business application, an analytics system, a student project, or a corporate data warehouse, the way you design your tables determines: How fast queries run How accurate your...
