by Peter Obikpe | Feb 16, 2026 | Data Analysis, Data Science
Web scraping is the process of automatically extracting data from websites for analysis, reporting, or integration into applications. Python, with its libraries like BeautifulSoup, provides a powerful and beginner-friendly way to scrape structured web data...
by Peter Obikpe | Feb 16, 2026 | Data Analysis
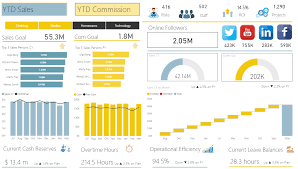
Power BI provides a wide range of visuals for presenting data, but raw charts and tables often need professional formatting to be truly effective. Proper formatting enhances readability, highlights important insights, and makes dashboards look polished. This article...

by Peter Obikpe | Feb 16, 2026 | Data Analysis
Power BI is powerful for visualization, but its true strength lies in DAX (Data Analysis Expressions). DAX allows you to move beyond basic totals and create intelligent, dynamic, and business-ready calculations. This article explains what DAX is, how it works, the...
by Peter Obikpe | Dec 20, 2025 | Data Analysis
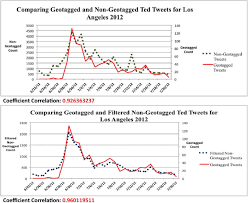
Line charts are one of the most effective visuals for showing trends over time. They help users understand how values change, identify growth or decline patterns, and compare performance across different periods. This article explains how to create a Line Chart in...
by Peter Obikpe | Dec 19, 2025 | Data Analysis
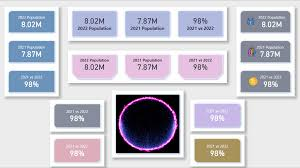
Card visuals are one of the simplest yet most powerful visuals in Power BI. They are used to display single, important values clearly and prominently. Card visuals are commonly placed at the top of dashboards to highlight key figures such as total sales, total...
by Peter Obikpe | Dec 18, 2025 | Data Analysis
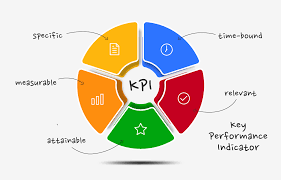
KPI (Key Performance Indicator) visuals are designed to show performance at a glance. They help decision-makers quickly understand whether a metric is improving, declining, or meeting its target. KPI visuals are widely used in executive dashboards, performance...
