by Peter Obikpe | Apr 20, 2026 | Data Science
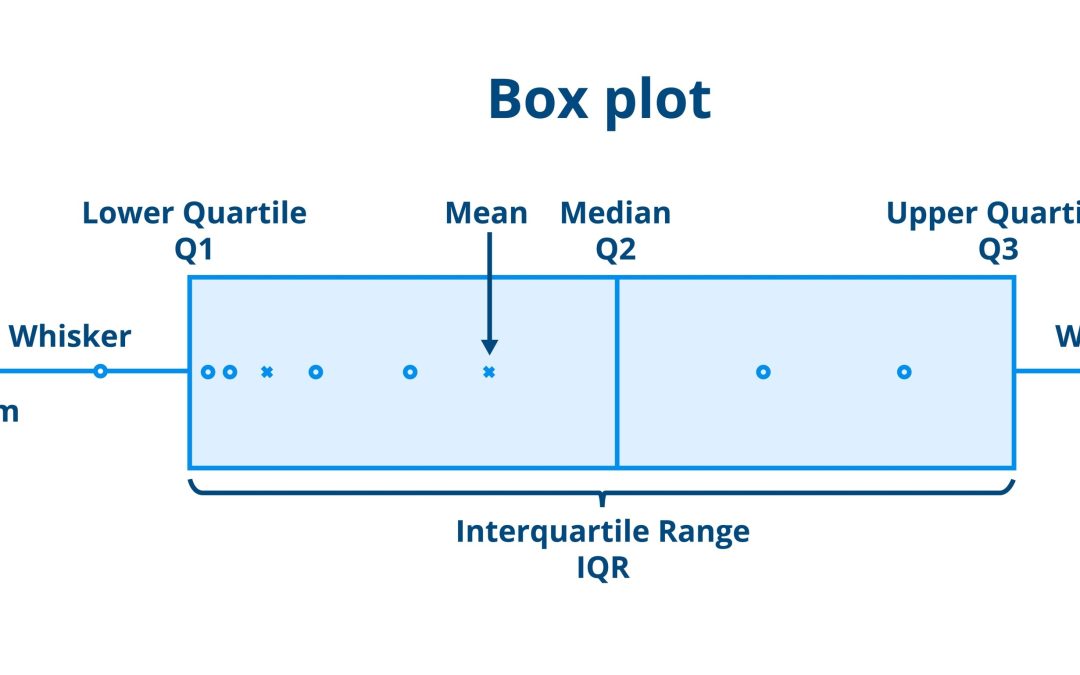
In the world of data science, outliers are like uninvited guests at a party—sometimes they provide surprising insights, but usually, they just mess up the vibe. An outlier is a data point that deviates significantly from the rest of the observations, potentially...

by Peter Obikpe | Apr 20, 2026 | Data Science
Working with time series data can feel like trying to organize a library while the shelves are moving. In Python, however, we have specialized tools that turn “messy dates” into “predictable patterns.” This guide covers the journey from loading...

by Peter Obikpe | Apr 13, 2026 | Data Analysis
Dashboards should be informative, but not cluttered. Adding too many visuals can overwhelm users. Tooltips solve this problem by allowing you to show additional insights only when needed. In Power BI, tooltips help you provide deeper context without taking up extra...
by Peter Obikpe | Apr 13, 2026 | Data Analysis
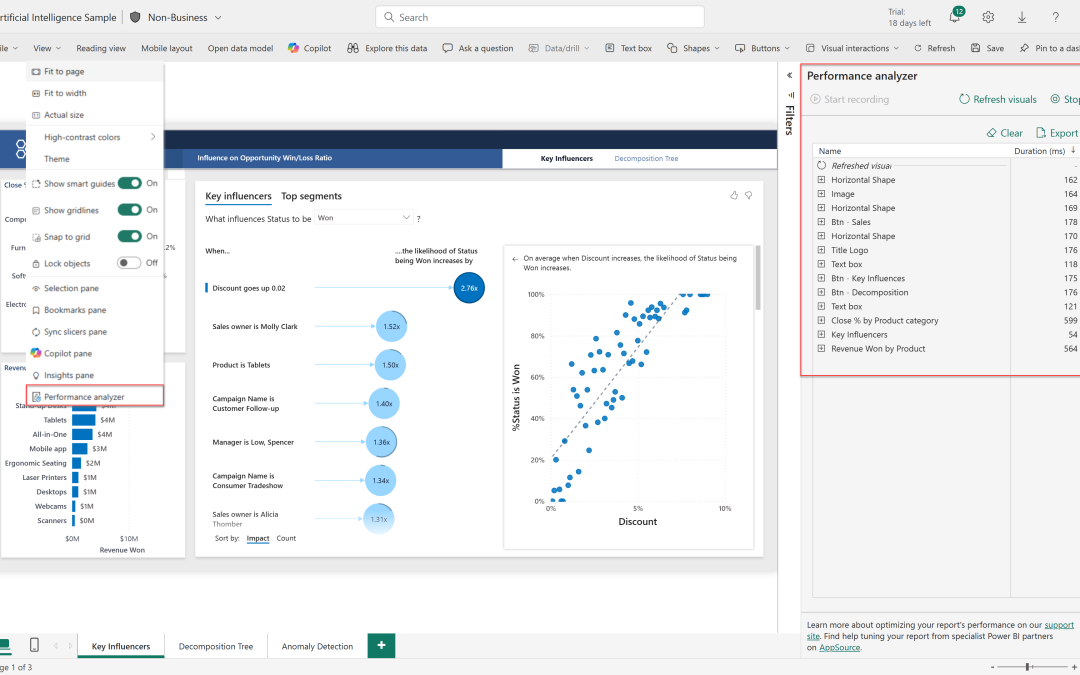
A slow dashboard can ruin the entire user experience. No matter how beautiful your visuals are, if users have to wait for them to load, the report becomes frustrating and ineffective. In Power BI, performance optimization is a critical skill that separates beginners...
by Peter Obikpe | Apr 13, 2026 | Data Analysis
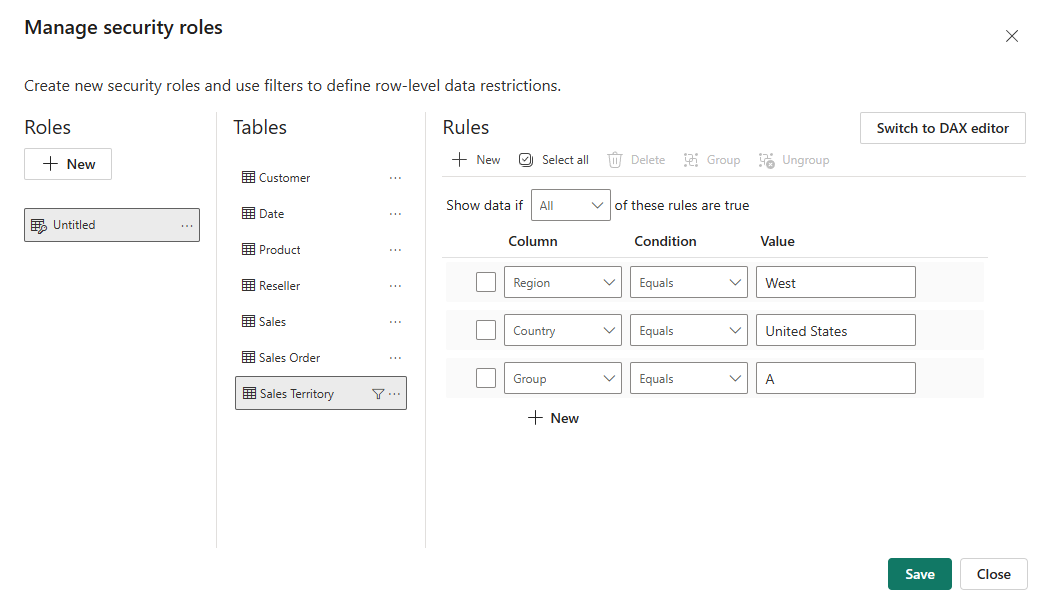
In real-world business environments, data is rarely meant for everyone. A regional manager should not see another region’s data, and employees should not access executive-level reports. This is where Row-Level Security (RLS) becomes essential in Power BI. RLS allows...
