
by Peter Obikpe | Mar 28, 2026 | Data Analysis
One of the most powerful features in Power BI is the ability to move from a summary dashboard into deeper details with just one click. This feature is called Drill-Through. Instead of overwhelming users with too much information on one page, drill-through reports...
by Peter Obikpe | Mar 28, 2026 | Data Analysis
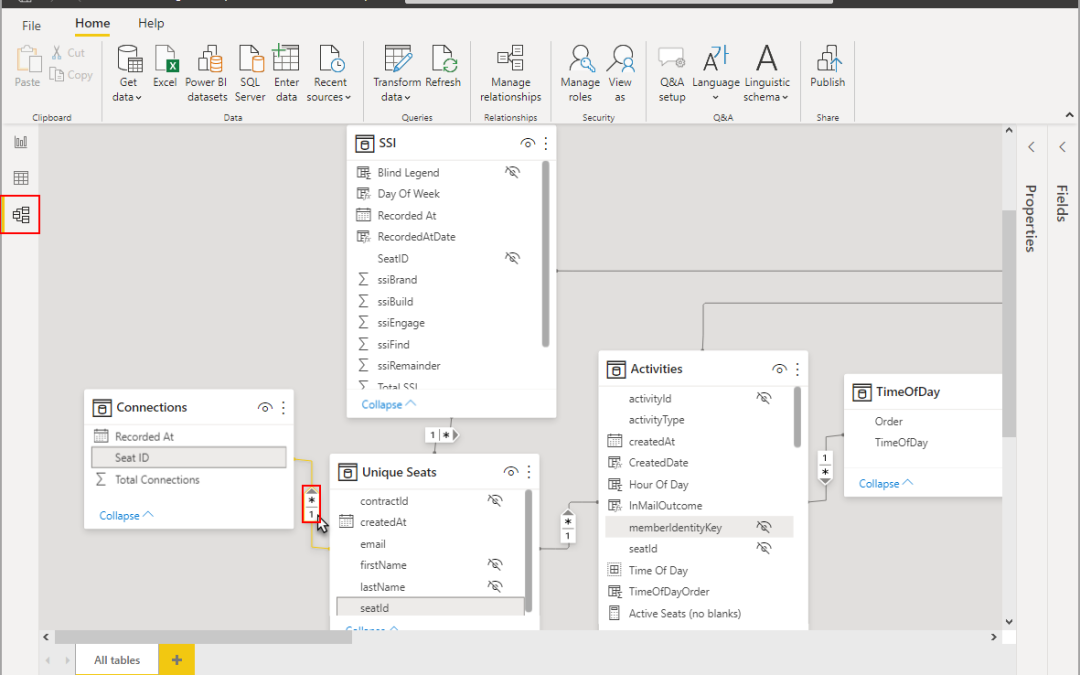
A beautiful dashboard is only as good as the data model behind it. In Power BI, data modeling is what connects your tables, controls how calculations behave, and ensures your visuals return accurate insights. Many beginners focus only on charts and DAX, but...

by Peter Obikpe | Mar 28, 2026 | Data Analysis
If Power BI is the engine of business intelligence, then DAX (Data Analysis Expressions) is the fuel that powers advanced insights. While charts and slicers make dashboards interactive, DAX is what allows analysts to create smart calculations, KPIs, and dynamic...
by Peter Obikpe | Mar 28, 2026 | Data Analysis, Microsoft Excel Articles
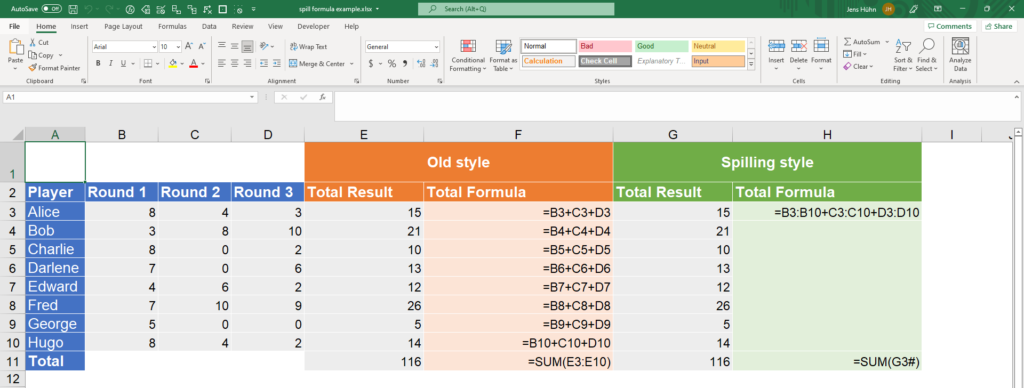
Modern Excel has changed the way professionals work with data through Dynamic Arrays. Instead of copying formulas down hundreds of rows, a single formula can now automatically spill results into multiple cells. This makes data analysis faster, cleaner, and far more...
by Peter Obikpe | Mar 28, 2026 | Data Analysis, Microsoft Excel Articles
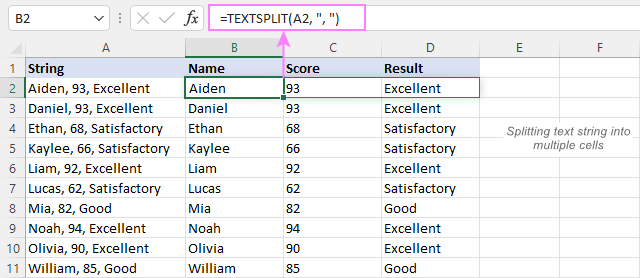
Excel is one of the most powerful tools for data analysis, but its true strength lies in its functions. The right functions can help you clean data, analyze trends, automate calculations, and uncover insights much faster than manual work. For data analysts, mastering...
