by Peter Obikpe | Apr 13, 2026 | Data Analysis
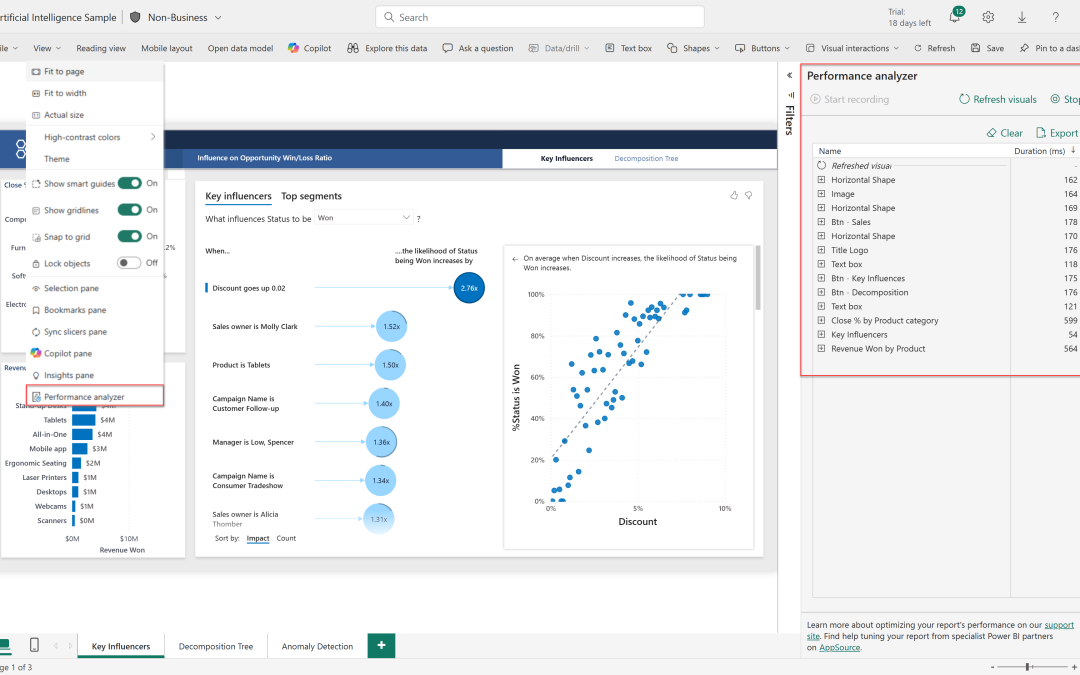
A slow dashboard can ruin the entire user experience. No matter how beautiful your visuals are, if users have to wait for them to load, the report becomes frustrating and ineffective. In Power BI, performance optimization is a critical skill that separates beginners...
by Peter Obikpe | Apr 13, 2026 | Data Analysis
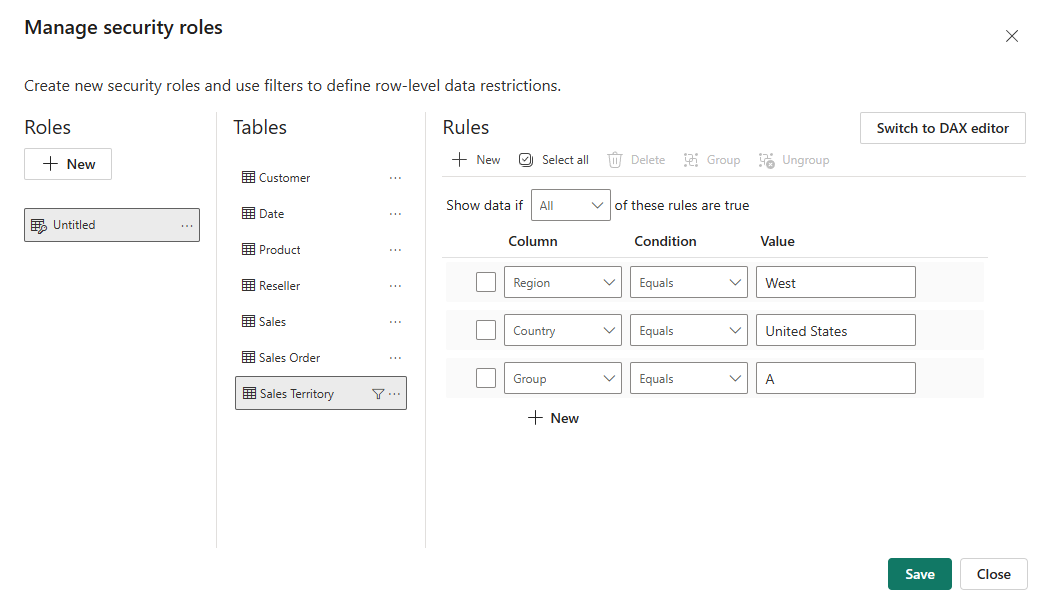
In real-world business environments, data is rarely meant for everyone. A regional manager should not see another region’s data, and employees should not access executive-level reports. This is where Row-Level Security (RLS) becomes essential in Power BI. RLS allows...
by Peter Obikpe | Apr 13, 2026 | Data Analysis
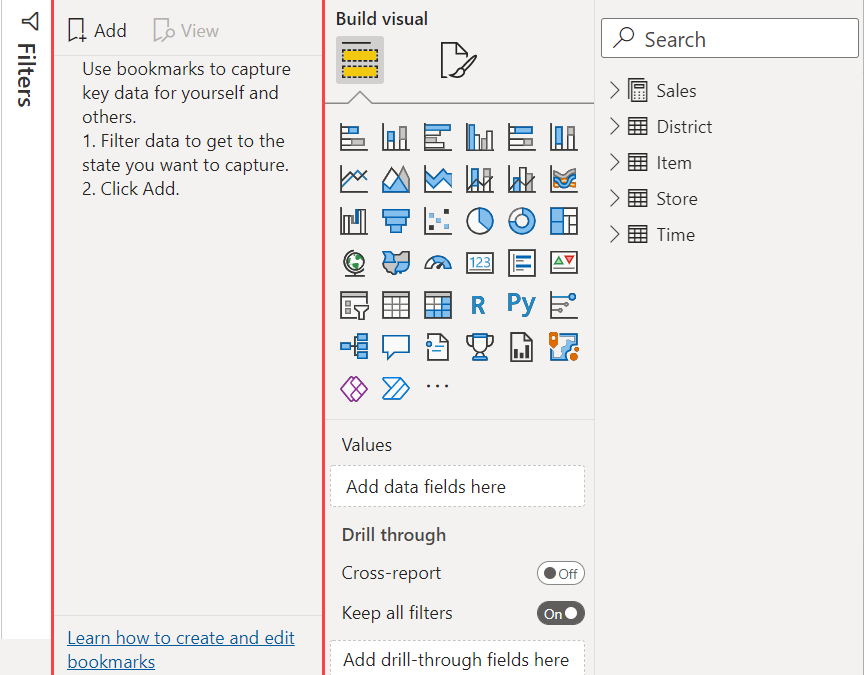
Modern dashboards are no longer just about displaying charts — they are about user experience. Users expect to interact with reports, switch between views, and explore insights without confusion. In Power BI, one of the most powerful ways to achieve this is through...
by Peter Obikpe | Apr 1, 2026 | Data Analysis
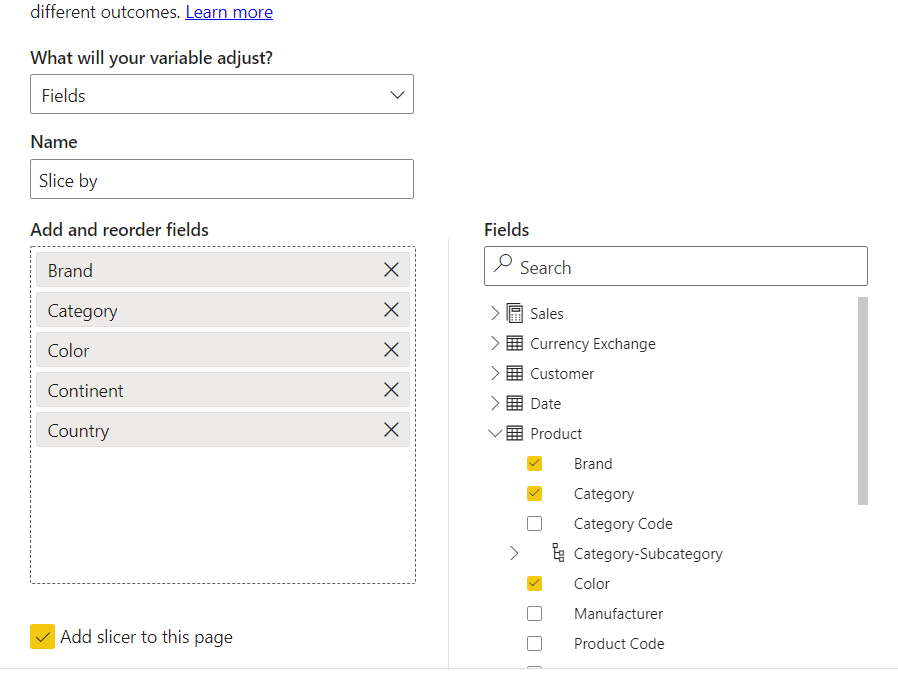
One of the newest and most powerful features in Power BI is Field Parameters. Most dashboards force users to view the same chart in the same way every time. Field Parameters allow users to choose what they want to see. Instead of creating separate visuals for every...
by Peter Obikpe | Apr 1, 2026 | Data Analysis
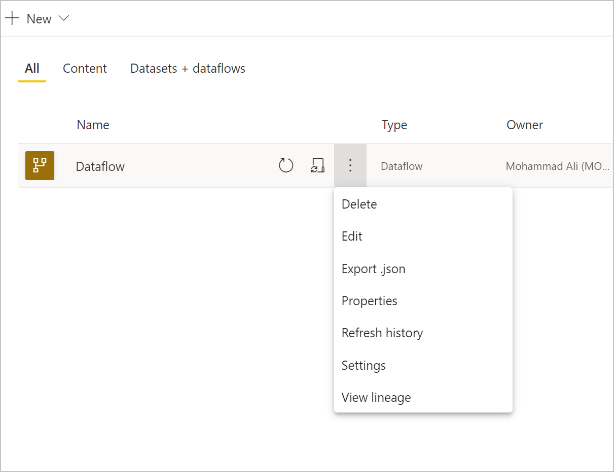
Many Power BI users import, clean, and transform the same data again and again in different reports. Over time, this creates duplicated effort, inconsistent calculations, and reports that become difficult to maintain. A smarter approach is to use Power BI Dataflows....

by Peter Obikpe | Mar 28, 2026 | Data Analysis
One of the most powerful features in Power BI is the ability to move from a summary dashboard into deeper details with just one click. This feature is called Drill-Through. Instead of overwhelming users with too much information on one page, drill-through reports...
