by Peter Obikpe | Feb 16, 2026 | Microsoft Excel Articles
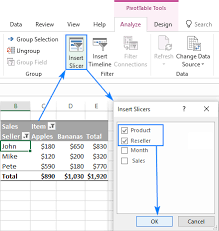
Slicers in Microsoft Excel are powerful tools that allow users to filter data in tables, PivotTables, and PivotCharts interactively. They provide a visual, clickable interface that makes filtering easier, faster, and more intuitive than traditional filter menus. This...
by Peter Obikpe | Feb 16, 2026 | Data Analysis
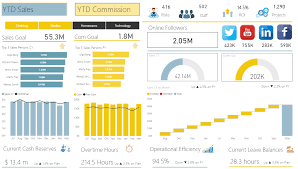
Power BI provides a wide range of visuals for presenting data, but raw charts and tables often need professional formatting to be truly effective. Proper formatting enhances readability, highlights important insights, and makes dashboards look polished. This article...

by Peter Obikpe | Feb 16, 2026 | Data Analysis
Power BI is powerful for visualization, but its true strength lies in DAX (Data Analysis Expressions). DAX allows you to move beyond basic totals and create intelligent, dynamic, and business-ready calculations. This article explains what DAX is, how it works, the...
by Peter Obikpe | Feb 16, 2026 | Data Science
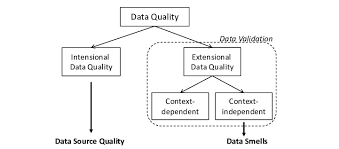
Data cleaning is one of the most critical steps in the data science workflow. Before analysis, modeling, visualization, or reporting can happen, the dataset must be accurate, consistent, and reliable. In fact, many professionals agree that data cleaning consumes up to...
by Peter Obikpe | Jan 31, 2026 | Data Science
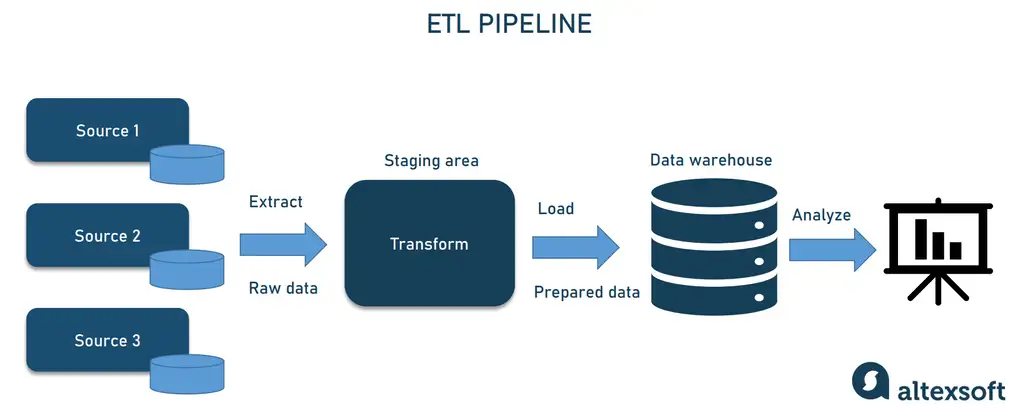
Data Science promises insights, efficiency, and smarter decision-making—but the reality is stark: over 80% of Data Science projects fail to deliver tangible results. The reasons are often not technical, but rooted in planning, communication, and execution. This...
by Peter Obikpe | Jan 31, 2026 | Data Science
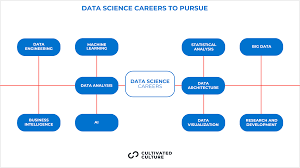
Data Science is one of the hottest career paths today, but breaking into the field can be confusing. Many aspiring data professionals wonder: “Should I focus on learning Python or dive straight into Machine Learning?” Both skills are important, but they serve very...

by Peter Obikpe | Jan 31, 2026 | Data Science
AI and automation are no longer futuristic concepts—they’re here, reshaping industries at lightning speed. But while some fear a robot takeover, the reality is more nuanced. Not all jobs are equally at risk, and understanding which roles are vulnerable can help you...
by Peter Obikpe | Dec 20, 2025 | Data Analysis
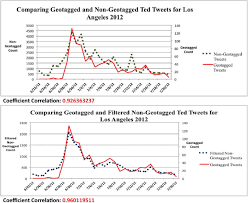
Line charts are one of the most effective visuals for showing trends over time. They help users understand how values change, identify growth or decline patterns, and compare performance across different periods. This article explains how to create a Line Chart in...
by Peter Obikpe | Dec 19, 2025 | Data Analysis
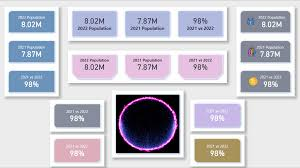
Card visuals are one of the simplest yet most powerful visuals in Power BI. They are used to display single, important values clearly and prominently. Card visuals are commonly placed at the top of dashboards to highlight key figures such as total sales, total...
by Peter Obikpe | Dec 18, 2025 | Data Analysis
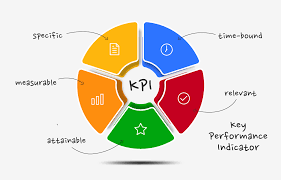
KPI (Key Performance Indicator) visuals are designed to show performance at a glance. They help decision-makers quickly understand whether a metric is improving, declining, or meeting its target. KPI visuals are widely used in executive dashboards, performance...
