by Peter Obikpe | Apr 20, 2026 | Data Science
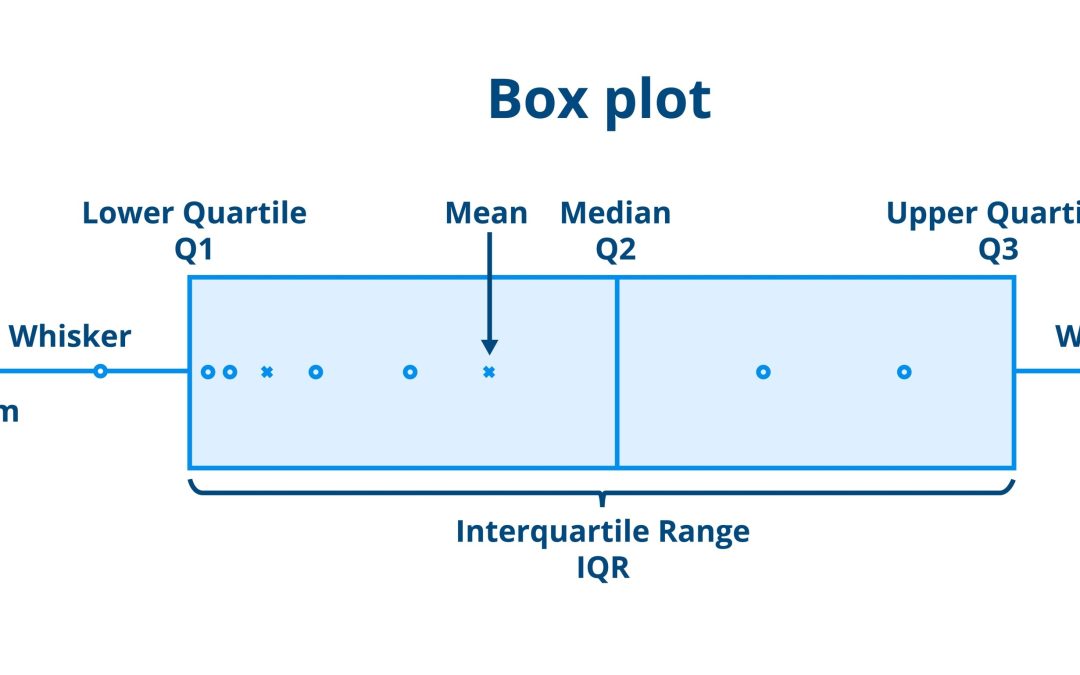
In the world of data science, outliers are like uninvited guests at a party—sometimes they provide surprising insights, but usually, they just mess up the vibe. An outlier is a data point that deviates significantly from the rest of the observations, potentially...

by Peter Obikpe | Apr 20, 2026 | Data Science
Working with time series data can feel like trying to organize a library while the shelves are moving. In Python, however, we have specialized tools that turn “messy dates” into “predictable patterns.” This guide covers the journey from loading...

by Peter Obikpe | Apr 13, 2026 | Data Analysis
Dashboards should be informative, but not cluttered. Adding too many visuals can overwhelm users. Tooltips solve this problem by allowing you to show additional insights only when needed. In Power BI, tooltips help you provide deeper context without taking up extra...
by Peter Obikpe | Apr 13, 2026 | Data Analysis
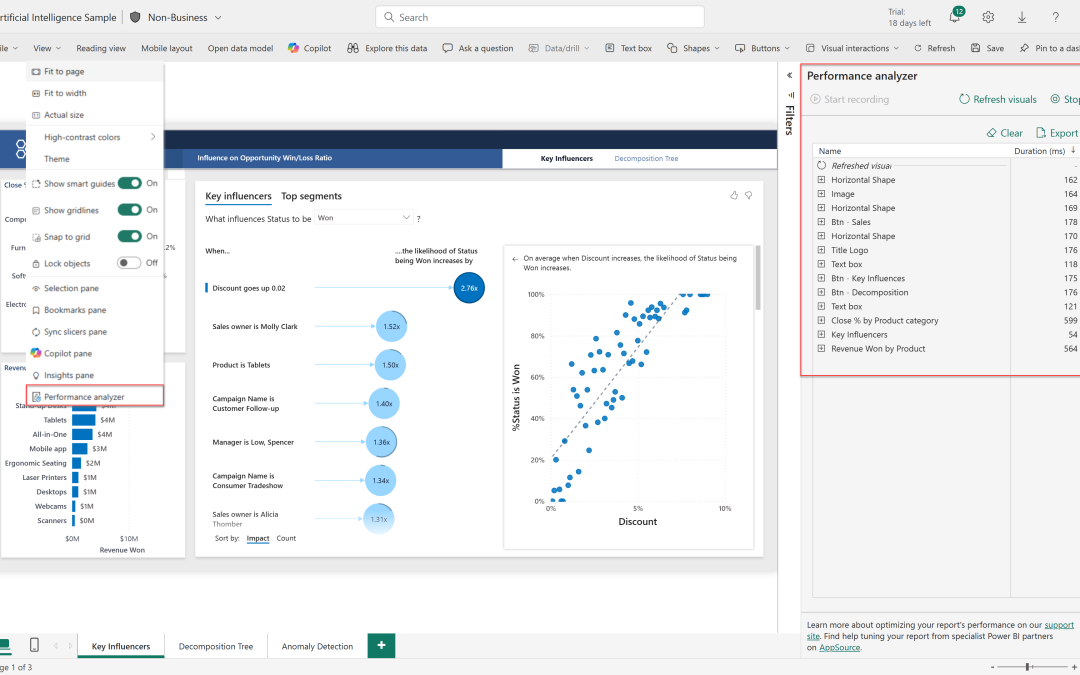
A slow dashboard can ruin the entire user experience. No matter how beautiful your visuals are, if users have to wait for them to load, the report becomes frustrating and ineffective. In Power BI, performance optimization is a critical skill that separates beginners...
by Peter Obikpe | Apr 13, 2026 | Data Analysis
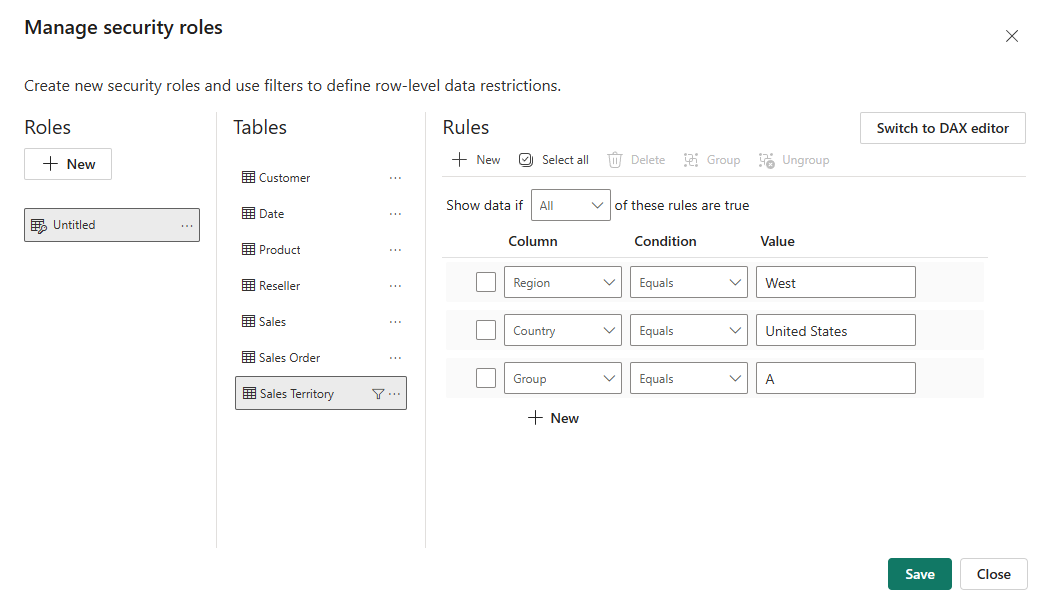
In real-world business environments, data is rarely meant for everyone. A regional manager should not see another region’s data, and employees should not access executive-level reports. This is where Row-Level Security (RLS) becomes essential in Power BI. RLS allows...
by Peter Obikpe | Apr 13, 2026 | Data Analysis
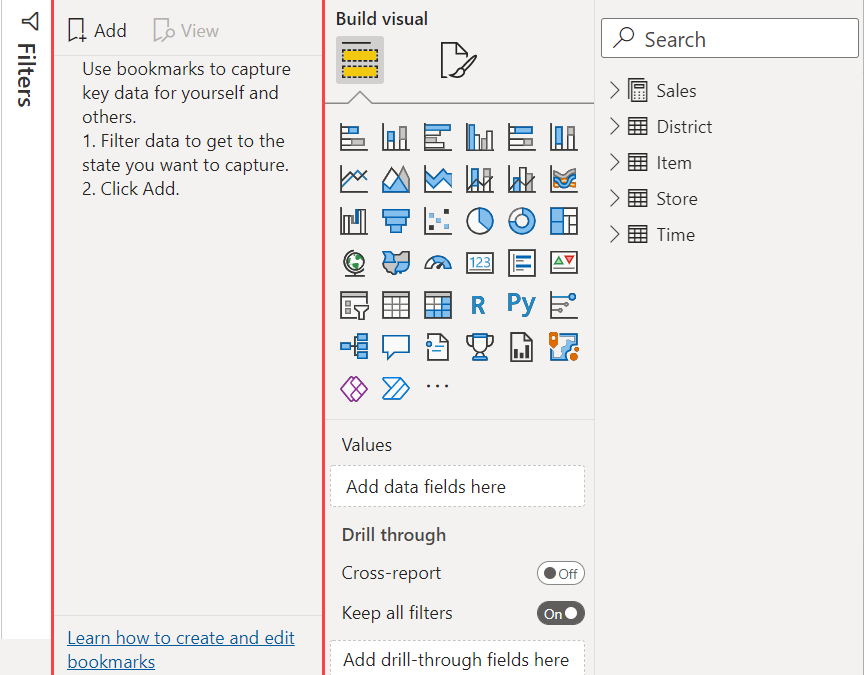
Modern dashboards are no longer just about displaying charts — they are about user experience. Users expect to interact with reports, switch between views, and explore insights without confusion. In Power BI, one of the most powerful ways to achieve this is through...
by Peter Obikpe | Apr 13, 2026 | Microsoft Excel Articles
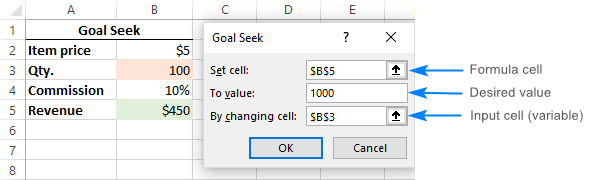
In business and data analysis, you often know the result you want, but not the input needed to achieve it. Instead of guessing values repeatedly, Excel provides a powerful tool called Goal Seek. Goal Seek allows you to work backward — finding the exact input required...
by Peter Obikpe | Apr 13, 2026 | Microsoft Excel Articles
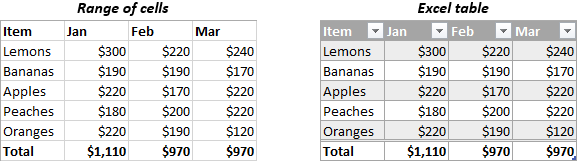
Most beginners use normal ranges, but professionals use Excel Tables. What is an Excel Table? Excel table is a named object that allows you to manage its contents independently from the rest of the worksheet data. Typically, a table contains related data that are...
by Peter Obikpe | Apr 13, 2026 | Microsoft Excel Articles
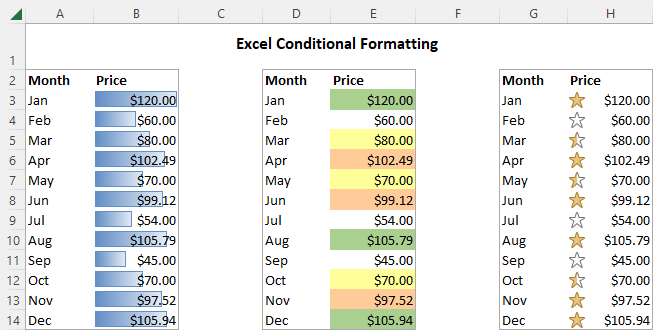
Numbers alone can be difficult to interpret. Conditional Formatting turns data into visual insights instantly. What is Conditional Formatting? It highlights cells based on conditions. What it is used for Identifying trends Highlighting top values Detecting errors...
by Peter Obikpe | Apr 13, 2026 | Microsoft Excel Articles
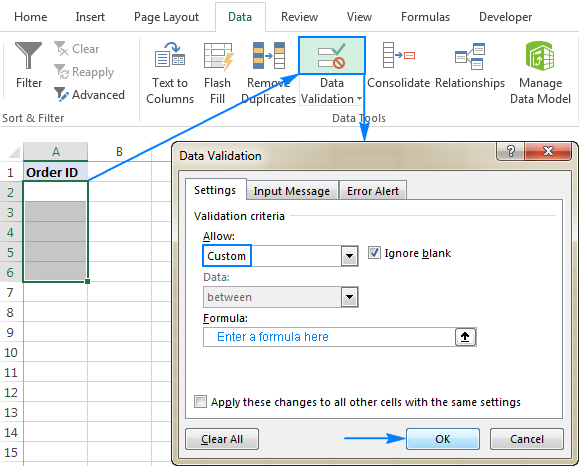
Excel Data Validation Deep Dive: Build Smart Forms That Prevent Errors Data entry errors are one of the biggest problems in Excel. A single mistake—wrong number, misspelled name, or invalid date—can affect your entire analysis. This is where Data Validation becomes...
